

NVDA explodes higher, plus the debt ceiling, Fed's inflation measure, and the week in review
The Sandbox Daily (5.26.2023)

Welcome, Sandbox friends.
Today’s Daily discusses:
NVDA explodes higher
debt ceiling debate brings us 6 days to the X-date
Fed's preferred gauge of inflation unexpectedly jumps
a brief recap to snapshot the week in markets
Monday is Memorial Day, so The Sandbox Daily will be taking a short break in observance of the holiday, returning to your inbox on Tuesday. A special thank you to all our brave readers who have served or are currently serving.

Let’s dig in.
Markets in review
EQUITIES: Nasdaq 100 +2.58% | S&P 500 +1.30% | Russell 2000 +1.05% | Dow +1.00%
FIXED INCOME: Barclays Agg Bond +0.08% | High Yield +0.61% | 2yr UST 4.568% | 10yr UST 3.813%
COMMODITIES: Brent Crude +1.14% to $77.13/barrel. Gold +0.13% to $1,964.9/oz.
BITCOIN: +1.02 to $26,743
US DOLLAR INDEX: -0.02% to 104.226
CBOE EQUITY PUT/CALL RATIO: 0.56
VIX: -6.22% to 17.95
Quote of the day
“One of the most valuable skills in life is being able to see another person's perspective. If you're going to someone's house, think about how it might feel to be the host. If you're creating a product, spend as much time as possible thinking like the customer. If you're calling customer service, think about how it might feel to be on the other end of the conversation. The more clearly you understand the viewpoint of your spouse or customer or coworker, the better positioned you are to find a solution.”
- James Clear, Atomic Habits
NVDA explodes higher
NVIDIA Corp. (NVDA) becomes the first of the group of “Super 7” stocks to close its drawdown gap from its prior all-time high peak.
These companies are critical in terms of products and innovation, with investor enthusiasm in these names helping fuel the post-GFC rally of the 2010s. Today, these stocks are driving a large part of 2023 market performance.
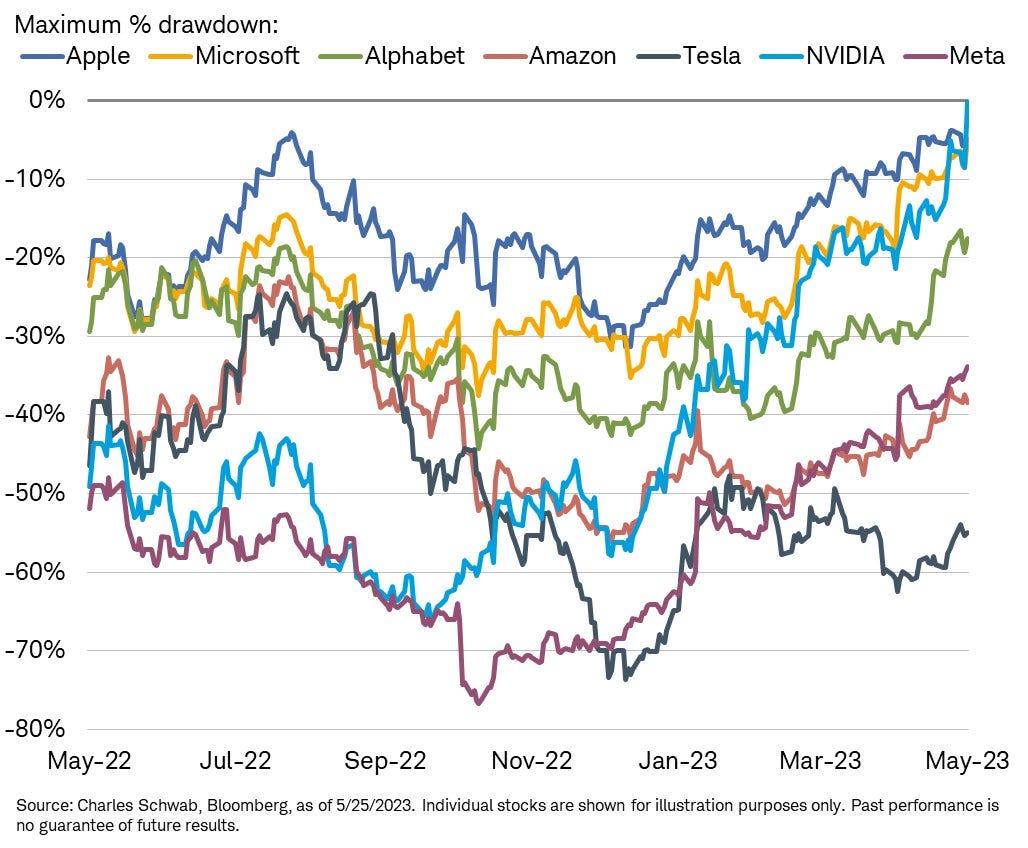
It’s important to keep in mind that this group encompasses Tech, Consumer Discretionary, and Communication Services sectors -> so it’s not all a “tech” trade the way it was once constructed.
But back to Nvidia for a moment.
NVDA blew the cover off the ball in terms of forward guidance for revenue during their recent quarterly earnings report: for the coming quarter ending July (2Q), Nvidia’s expecting $11B in sales — which is 50% higher than analysts expected. The market celebrated the report by adding $184 billion dollars in market cap in one day, which is the equivalent to adding one Adobe Inc. ($180bn).

The company’s guidance and artificial intelligence (AI) business has resulted in a massive move, with NVDA now at fresh all-time highs in absolute terms. Nvidia stock is up ~250% from its October lows, making it the best performer in the S&P 500 since equity markets bottomed last year.
Source: Liz Ann Sonders, All Star Charts
Debt ceiling debate brings us 6 days to the X-date
The U.S. debt ceiling debate continues to dominate the headlines, and recent reports out of Washington, D.C. suggest lawmakers are aggressively working on a deal – with an announcement potentially coming as early as Memorial Day Weekend. U.S. Treasury Secretary Janet Yellen estimates that the Treasury could run out of money on June 1st, 6 days from today.
With negotiations dragging, the Fitch Ratings agency filed a report on Wednesday that they had placed U.S. debt on “rating watch negative”. This signals that the agency could possibly downgrade the country’s AAA credit rating if politicians aren’t able to come to an agreement.
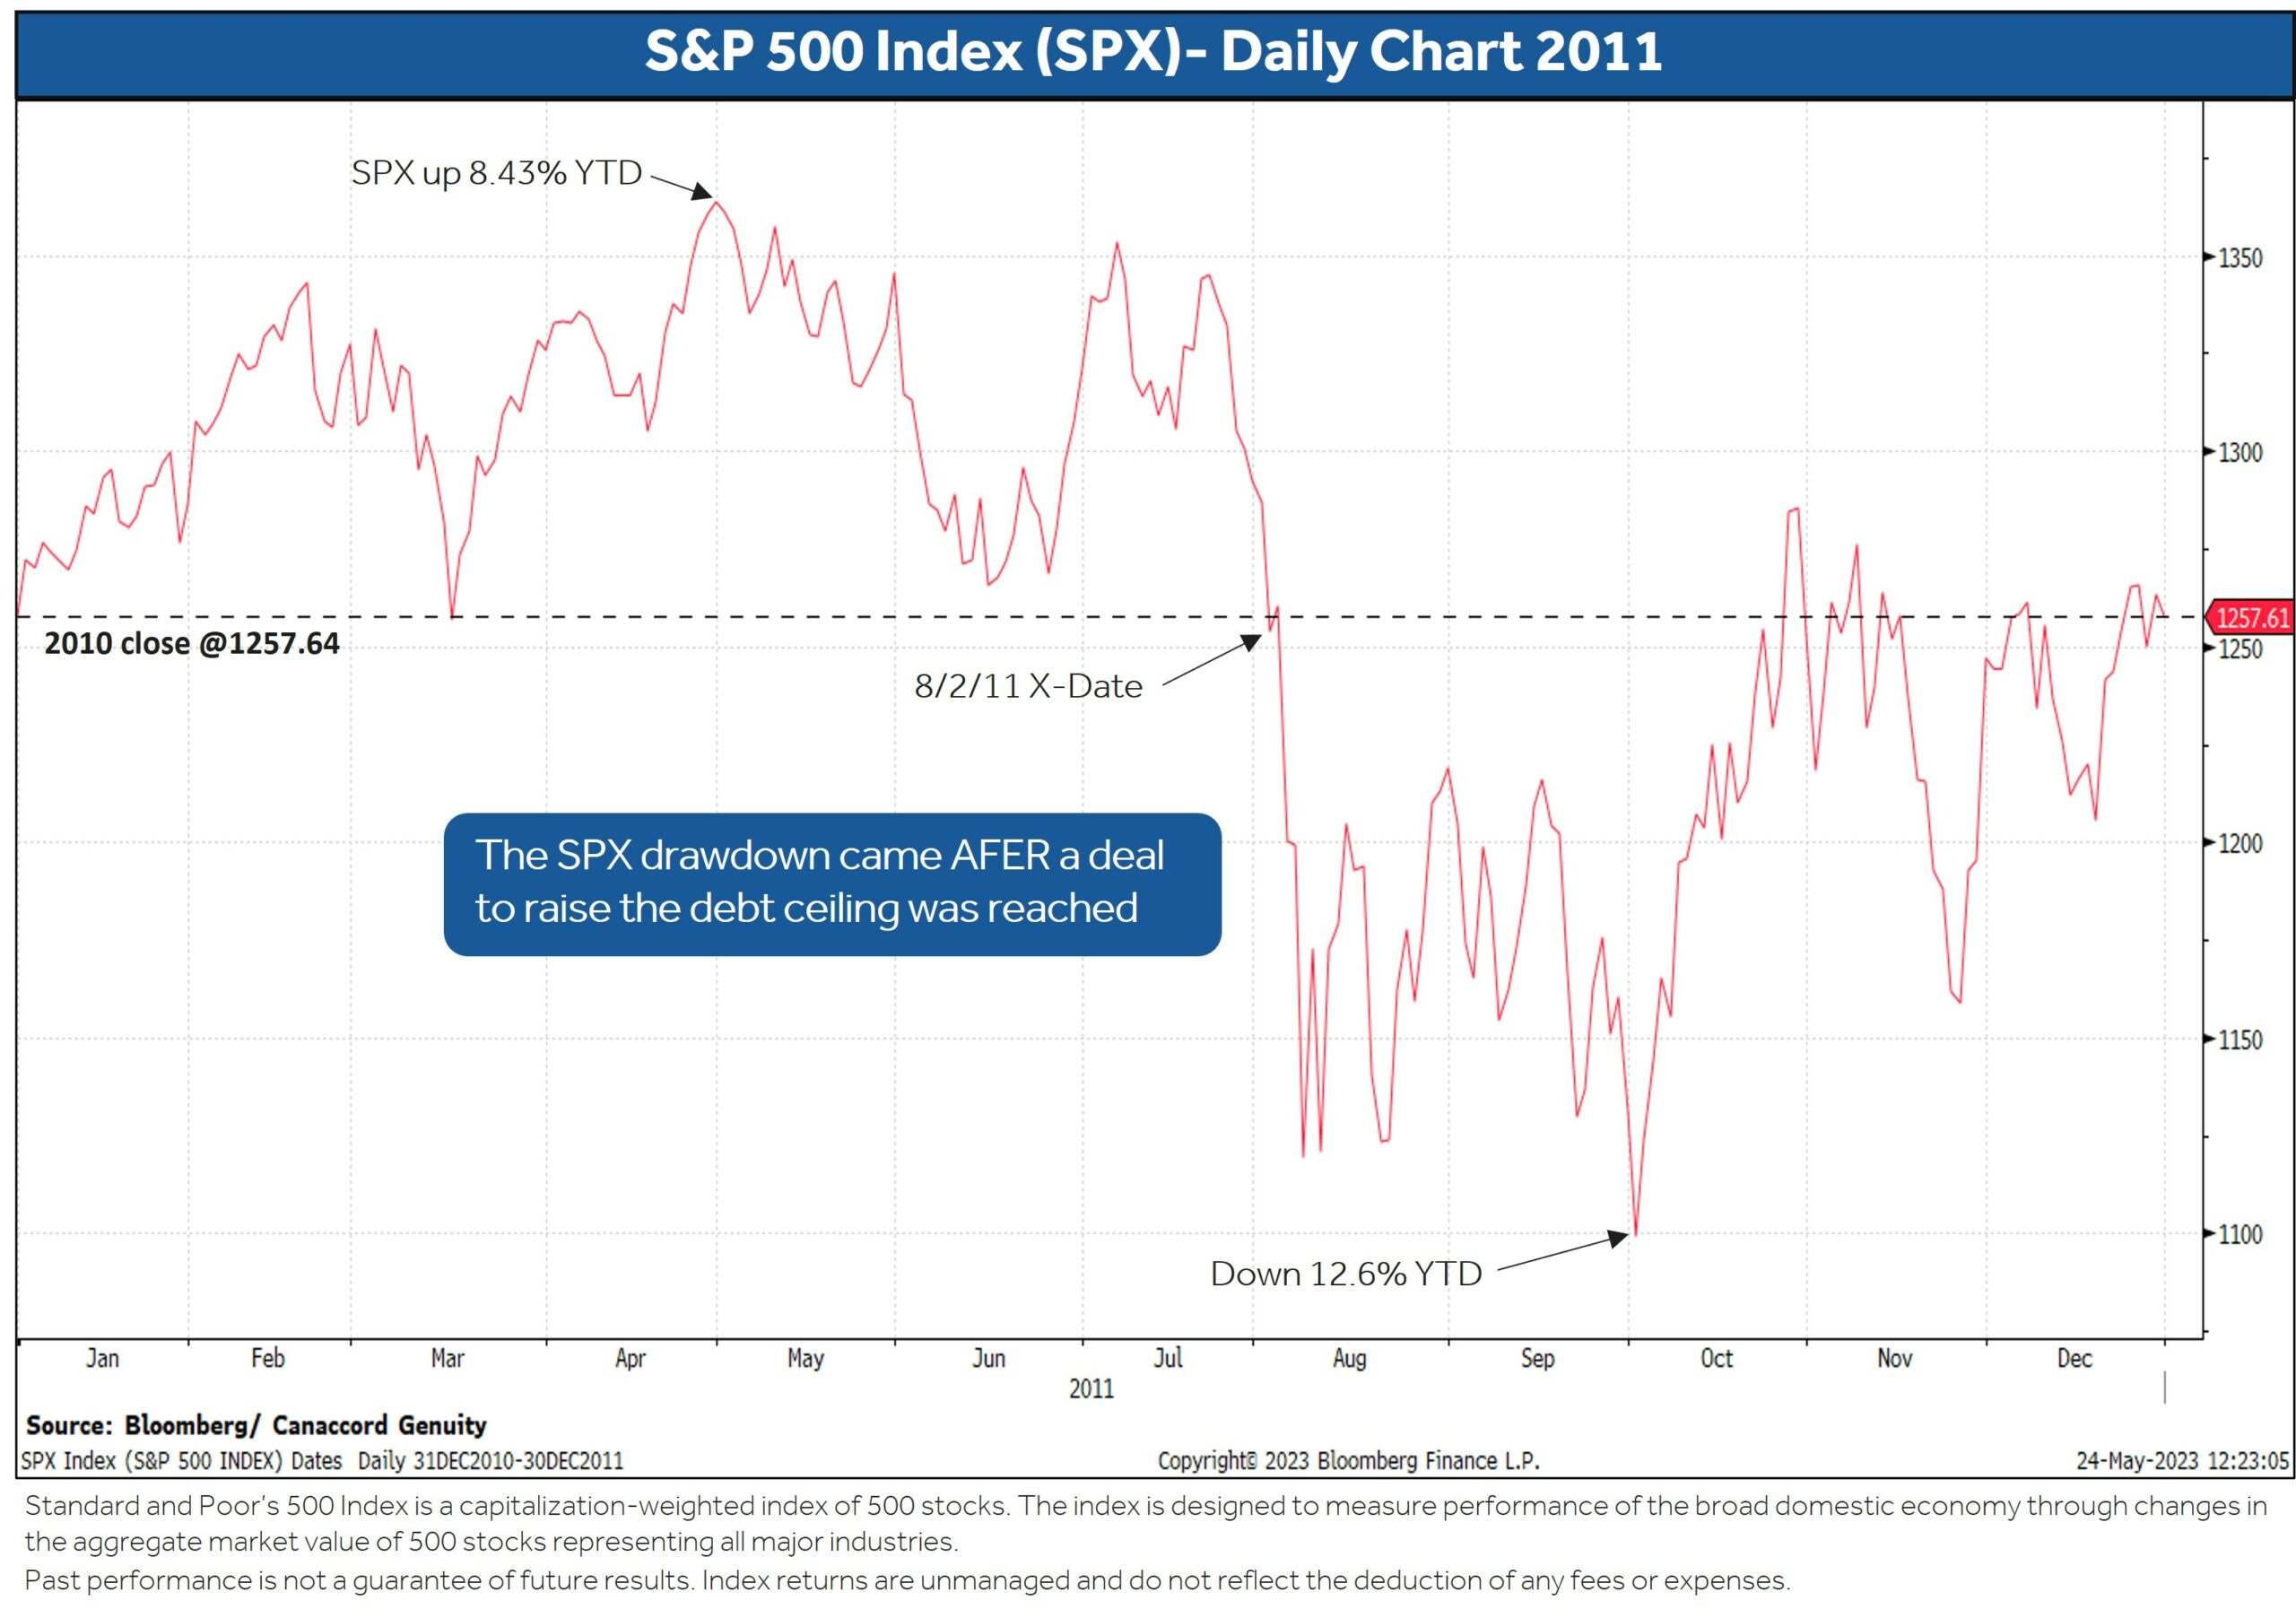
Comparisons are being made to 2011, when the lawmakers struggled to raise the debt ceiling, creating fears of a government shutdown. This led to Standard and Poor’s 1st-ever downgrade of the U.S. debt rating from AAA to AA+ on August 5, 2011, where it remains today. The downgrade came three weeks after S&P put the U.S. on “CreditWatch Negative.” The downgrade also came days after a deal had been reached to raise the debt ceiling, which President Obama signed on August 2.

So... is recent market volatility more to do with concerns of a “soft landing” or the beginning of a debt ceiling drawdown (à la replay of 2011)?
Here is how the market traded around the events back in 2011. A strong start through April, rockiness and a significant drawdown around the debt ceiling, and then a ferocious rally into year-end to end 2011 flat.
Source: Dwyer Strategy
Fed's preferred gauge of inflation unexpectedly jumps
PCE inflation, the Fed's "preferred inflation gauge," rose to +4.4% year-on-year, above expectations of +3.9% YoY, marking the first increase in the personal consumption expenditures index (PCE inflation) since September last year. Core PCE, stripping away the volatile food and energy components, rose +4.7% versus one year ago.
U.S. inflation and consumer spending accelerated last month, highlighting steady price pressures and demand that will keep Federal Reserve policy makers tilted toward raising interest rates further.

While the pace of inflation has moderated since peaking a year ago, resilient demand is keeping price pressures elevated. That’s the challenge facing Fed officials as they debate whether to pause their rate hiking campaign and assess implications of tighter policy on the banking system and economy more broadly.
It’s likely to believe that the Fed rate hike in May was the last one of this tightening cycle, but the re-acceleration in inflation suggests that rates will remain higher for longer.
Source: Ned Davis Research, Bloomberg
The week in review
Talk of the tape: Debt ceiling, debt ceiling, debt ceiling. Get this deal done now.
Stocks: U.S. stocks ended the week mixed as growth sectors continue to lead. Year to date, growth sectors have outperformed as some investors believe the slowing economy will cause the Federal Reserve to pivot. Positive developments surrounding artificial intelligence have also helped these sectors advance, highlighted this week by Nvidia’s blowout earnings report. Nevertheless, some investors question elevated valuations..
Yesterday was the 100th trading day of the year and it has been a very productive first 100 days for stocks for sure. Through yesterday, about 40% of the way through the year, the S&P 500 Index has gained a solid +8.1% (excluding dividends). Since 1950, in years when the S&P 500 has been up at least 7% through the first 100 trading days, the average gain over the rest of the year has been a robust 9.4%. That compares to the average gain of +5.4% in all years from trading day #101 through year end.
Bonds: The Bloomberg Aggregate Bond Index finished lower as bond prices declined while yields increased. Expected interest rate volatility, as measured by the MOVE Index, remains elevated relative to the last decade; volatility will remain elevated as long as the Fed remains committed to reducing the size of its balance sheet.
Commodities: Energy prices finished higher this week as global economic sentiment has improved. In addition, crude oil prices are showing signs of turning the corner. Consumer demand for gasoline is projected to climb as the U.S. enters the summer driving season. Also potentially supporting prices: the Department of Energy announced plans for re-stocking the country’s Strategic Petroleum Reserve, OPEC+ production cuts, and concerns over the debt ceiling abating as negotiations progress.

Source: Dwyer Strategy, LPL Research
That’s all for today.
Blake
Welcome to The Sandbox Daily, a daily curation of relevant research at the intersection of markets, economics, and lifestyle. We are committed to delivering high-quality and timely content to help investors make sense of capital markets.
Blake Millard is the Director of Investments at Sandbox Financial Partners, a Registered Investment Advisor. All opinions expressed here are solely his opinion and do not express or reflect the opinion of Sandbox Financial Partners. This Substack channel is for informational purposes only and should not be construed as investment advice. Clients of Sandbox Financial Partners may maintain positions in the markets, indexes, corporations, and/or securities discussed within The Sandbox Daily.