Perspective on the 5-month rally, plus rate cuts, tax brackets, and market benchmarks
The Sandbox Daily (4.22.2024)
Welcome, Sandbox friends.
Today’s Daily discusses:
historical perspective on recent 5-month monster rally
from hikes to cuts
tax rates are low by historical standards
forget beating some arbitrary index
Let’s dig in.
Markets in review
EQUITIES: Nasdaq 100 +1.02% | Russell 2000 +1.02% | S&P 500 +0.87% | Dow +0.67%
FIXED INCOME: Barclays Agg Bond +0.06% | High Yield +0.55% | 2yr UST 4.971% | 10yr UST 4.615%
COMMODITIES: Brent Crude -0.16% to $87.15/barrel. Gold -2.94% to $2,342.9/oz.
BITCOIN: +3.05% to $66,595
US DOLLAR INDEX: -0.02% to 106.129
CBOE EQUITY PUT/CALL RATIO: 0.65
VIX: -9.46% to 16.94
Quote of the day
“Life is 10% what happens to me and 90% of how I react to it.”
- Charles Swindoll
Historical perspective on recent 5-month monster rally
The recent few weeks of elevated volatility and selling pressure on risk assets seem to have rattled investors with the major averages experiencing its first 5% pullback of the year. Yet, context is everything.
From the October 2023 lows to March 2024 month-end, the S&P 500 index achieved positive returns in 18 of 22 weeks, only then to suffer three straight red weekly candles in April.
Over that 5-month monster rally, the S&P 500 index surged 25.3% – only the 7th time the benchmark has gained more than 25% over a 5-month period since World War II.
The interesting takeaway here is March 2024 is the one major exception – excluding March 1986 – that did not follow a major cyclical bear market.
If you train your eyes to the 3rd column “Previous Year Max Drawdown,” most of these historical monster rallies came after recessions or bear markets. February 1975 was just months after the brutal 1973-74 recession and bear market. November 1982 came a few months after a secular low. January 1999, July 2009, and August 2020 followed the Asian financial crisis, Great Recession, and COVID-19 shutdown, respectively. In fact, the median drawdown over the previous year was -26.6%.
This analysis speaks to the deep-rooted recession fears and pessimism – from corporate board rooms to institutional and retail investors, alike – that accompanied this historic market rally over the last few months.
Source: Ned Davis Research
From hikes to cuts
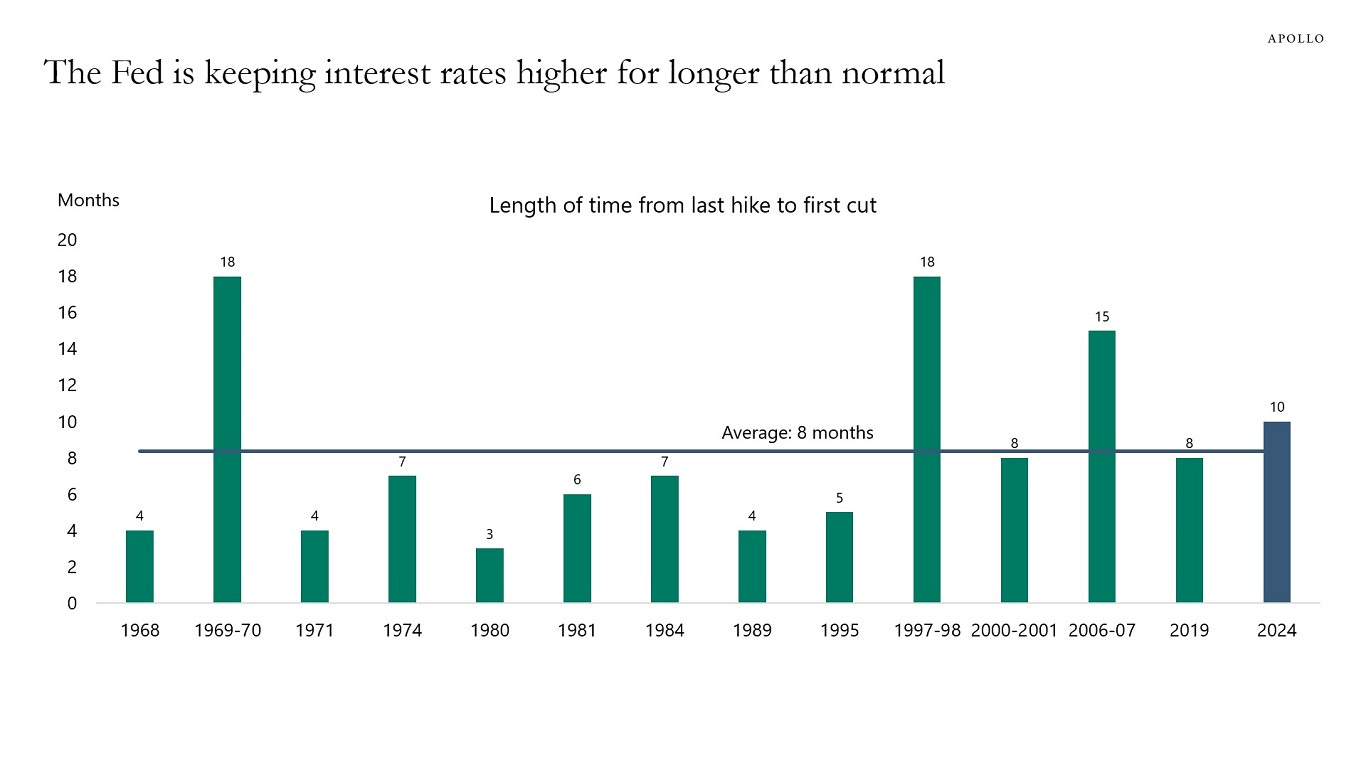
Over the last 50+ years, the average length of time from the final rate hike of a tightening cycle to the first rate cut of an easing cycle is 8 months.
Assuming July 2023 was indeed the last rate hike of this cycle from the Federal Reserve, then the Fed should have started cutting rates last month (March) based on historical averages and precedent.
The big difference today is that inflation remains significantly above the FOMC’s 2% target.
As Torsten writes:
“With easy financial conditions still giving a significant boost to inflation and growth over the coming quarters, the risks are rising that we could see a Fed cycle that is very different, with the Fed keeping rates higher for much longer than we usually see.”
Source: Torsten Slok
Tax rates are low by historical standards
Taxes are always top-of-mind for households. Many worry that taxes could increase in the coming years – after all, persistent budget deficits and the level of the national debt can only be improved either with reduced spending or increased revenues.
Historically, the top tax rates have been much higher, especially during wartime.
As shown in the chart below, the highest tax rates, which reached 94% in the mid-20th century, have been much lower since the Reagan tax cuts.
Source: Clearnomics
Forget beating some arbitrary index
When it comes to personal finance, what matters is not beating some index. What matters is meeting your own personal goals.
Sure, investment results are important, but those returns are only one piece to the puzzle. Outperforming an index has nothing to do with meeting your personal financial goals. That has everything to do with careful and ongoing financial planning.
For a minute, pretend you live in some magic fantasy world like Neverland where all of your dreams – according to the investment industry – come true, and you actually beat an index every quarter, or every year, for your whole life. It's quite possible – even in this unlikely scenario – that you still don't meet any of your financial goals.
Source: The Behavior Gap
That’s all for today.
Blake
Welcome to The Sandbox Daily, a daily curation of relevant research at the intersection of markets, economics, and lifestyle. We are committed to delivering high-quality and timely content to help investors make sense of capital markets.
Blake Millard is the Director of Investments at Sandbox Financial Partners, a Registered Investment Advisor. All opinions expressed here are solely his opinion and do not express or reflect the opinion of Sandbox Financial Partners. This Substack channel is for informational purposes only and should not be construed as investment advice. The information and opinions provided within should not be taken as specific advice on the merits of any investment decision by the reader. Investors should conduct their own due diligence regarding the prospects of any security discussed herein based on such investors’ own review of publicly available information. Clients of Sandbox Financial Partners may maintain positions in the markets, indexes, corporations, and/or securities discussed within The Sandbox Daily. Any projections, market outlooks, or estimates stated here are forward looking statements and are inherently unreliable; they are based upon certain assumptions and should not be construed to be indicative of the actual events that will occur.


