

Presidential elections impact on stock markets, plus small-cap migrations, rate expectations, and debt maturity schedule
The Sandbox Daily (3.11.2024)

Welcome, Sandbox friends.
Today’s Daily discusses:
how presidential elections affect the stock market
small-caps lack of upward migration
rate expectations
debt schedule for the S&P 1500
Let’s dig in.
Markets in review
EQUITIES: Dow +0.12% | S&P 500 -0.11% | Nasdaq 100 -0.37% | Russell 2000 -0.81%
FIXED INCOME: Barclays Agg Bond -0.11% | High Yield -0.01% | 2yr UST 4.538% | 10yr UST 4.098%
COMMODITIES: Brent Crude +0.43% to $82.43/barrel. Gold +0.13% to $2,188.4/oz.
BITCOIN: +4.82% to $72,351
US DOLLAR INDEX: +0.13% to 102.849
CBOE EQUITY PUT/CALL RATIO: 0.56
VIX: +3.26% to 15.22
Quote of the day
“That men do not learn very much from the lessons of history is the most important of all the lessons that history has to teach.”
- Aldous Huxley
How presidential elections affect the stock market
With the presidential election season heating up, there will no doubt be a flurry of daily headlines between now and election day on November 5th. A rematch between incumbent President Joe Biden and former President Donald Trump is all but set in stone.
Although a lot can happen between now and November, it's natural for some investors to be concerned about the impact of politics on the stock market and economy. After all, the political climate has never felt more polarized not just due to elections, but also disagreements in Washington around the budget, immigration, foreign policy, and countless other measures. How can investors stay balanced during this year's presidential election?
For one, keep in mind the economy and stock market have performed well across both parties. Focusing too much on who was in the White House would have resulted in poor investment decisions over history.

Second, for most long-term investors, it makes more sense to focus on fundamentals such as those related to the business cycle, rather than day-to-day election coverage.
On a short-term basis, election headlines have the power to move markets and create stock market volatility. However, these moves are eclipsed by the long-term gains created by market and business cycles. These cycles are influenced by many factors, from technological revolutions to globalization, and not just who is sitting in the Oval Office.

Of course, this is not to say that good policy doesn't matter. Policies on taxes, trade, industrial activity, antitrust regulation, and more can have important impacts on specific industries which can then affect the broader economy.
However, not only do policy changes tend to be incremental, but also history shows that it is very difficult to predict how any particular policy might affect the economy and markets, despite conventional wisdom about each party. Stock prices account for new policies quickly and companies and industries tend to adjust and adapt.
Source: Clearnomics
Small-caps lack of upward migration
Investing in small-caps means buying into companies with a market capitalization of roughly $2 billion, or smaller. This marker represents the 70th percentile market cap in the U.S market today, while the 90th percentile – often a marker for mid-caps – is $10B and large caps are those remaining companies above and beyond $10B.
A company can transition from the small-cap index to the mid- or large-cap index by surpassing a predetermined threshold set by the index provider, with the primary determinant based on increases to their market cap. These shifts may reflect increased investor confidence, heightened stock prices, improved balance sheet and cash flow metrics, and sustained business expansion.
So, how often does this upward migration of small-caps occur?
Verdad found that over the last 20 years, the average annual migration rate from the small-cap universe to the mid- and large-cap universe was just 4%.
89% of small-cap companies remain small-caps one year later, while 8% exit the universe (often due to buyout, de-listing, or bankruptcy).

Below are the results for other select regions of equity markets, where notably Japan does not see much upward movement in their small-cap universe.
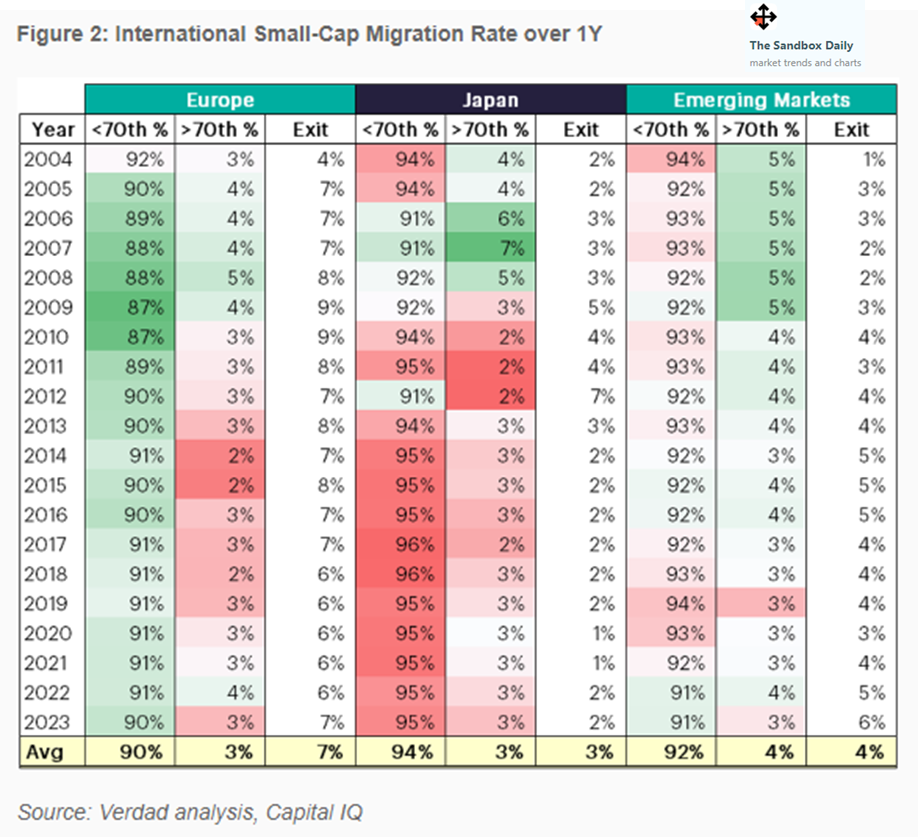
Source: FINRA, Verdad Cap
Rate expectations
Looking at the distribution of easing, the amount now expected in the first half of 2024 is quite modest as a fraction of the overall move, as interest rate cut expectations have shifted from early 2024 to 2H24 and even into 1H25.
The rapid change in market pricing aligns with both Chair Powell and President Lagarde’s comments last week stressing that patience is still needed and imminent rate cuts are quite unlikely.
Source: J.P. Morgan Markets
Debt schedule for the S&P 1500
Market rates remain at elevated levels amidst uncertainty on the timing and pace of the upcoming Fed easing cycle. At this point, the level of interest rates is the common thread amongst top investor concerns.
The chart below identifies the debt maturity wall for companies across the S&P 1500 – a composite of the S&P 500 (large-caps), S&P 400 (mid-caps), and S&P 600 (small-caps) – which covers 90% of the market capitalization of U.S. stocks, so it represents a broad swath of the domestic market’s exposure to the path of interest rates ahead.

Nearly a third of all debt is coming due in every sector within the next five years.

The longer rates remain elevated, the bigger the impact that the debt refinance wall will have on earnings and growth.
Source: Piper Sandler
That’s all for today.
Blake
Welcome to The Sandbox Daily, a daily curation of relevant research at the intersection of markets, economics, and lifestyle. We are committed to delivering high-quality and timely content to help investors make sense of capital markets.
Blake Millard is the Director of Investments at Sandbox Financial Partners, a Registered Investment Advisor. All opinions expressed here are solely his opinion and do not express or reflect the opinion of Sandbox Financial Partners. This Substack channel is for informational purposes only and should not be construed as investment advice. The information and opinions provided within should not be taken as specific advice on the merits of any investment decision by the reader. Investors should conduct their own due diligence regarding the prospects of any security discussed herein based on such investors’ own review of publicly available information. Clients of Sandbox Financial Partners may maintain positions in the markets, indexes, corporations, and/or securities discussed within The Sandbox Daily. Any projections, market outlooks, or estimates stated here are forward looking statements and are inherently unreliable; they are based upon certain assumptions and should not be construed to be indicative of the actual events that will occur.