Reasons to sell, plus the average stock (RSP), corporate bond issuance, and labor strikes
The Sandbox Daily (10.5.2023)
Welcome, Sandbox friends.
Today’s Daily discusses:
reasons to sell
the average stock should be (hopefully) forming a local bottom
2023 corporate bond issuance
resurgence in labor movements
Let’s dig in.
Markets in review
EQUITIES: Russell 2000 +0.14% | Dow -0.03% | S&P 500 -0.13% | Nasdaq 100 -0.36%
FIXED INCOME: Barclays Agg Bond +0.06% | High Yield +0.10% | 2yr UST 5.023% | 10yr UST 4.716%
COMMODITIES: Brent Crude -1.95% to $84.14/barrel. Gold -0.06% to $1,833.7/oz.
BITCOIN: -1.06% to $27,431
US DOLLAR INDEX: -0.42% to 106.347
CBOE EQUITY PUT/CALL RATIO: 1.11
VIX: -0.48% to 18.49
Quote of the day
“In a world that is constantly changing, there is no one subject or set of subjects that will serve you for the foreseeable future, let alone for the rest of your life. The most important skill to acquire now is learning how to learn.”
- John Naisbitt, NY Times Best Seller
Reasons to sell
There’s always a “reason to sell.”
Right now it’s interest rates. Last year it was inflation. In 2020, it was the COVID-19 pandemic. Other years it’s wars, bankruptcies, frauds, recessions, valuations, politics, etc. etc.
Yet, for long-term investors, staying invested is often the best choice, not just for your bottom line but also keeping a cool head.
The S&P 500 has increased an average of 9.91% each year for more than 30 years, or said differently, a 2,390% cumulative total return (including dividends) – through all the noise and scary headlines.
Source: YCharts
The median stock should be forming a local bottom, hopefully
The S&P 500 index is comprised of the 500 biggest companies in the United States, weighted by market capitalization. This means that the biggest names can move the price more than the smaller ones.
However, the Invesco S&P 500 Equal-Weight ETF (RSP) takes the same 500 stocks and weights them equally. This minimizes the outsized effects of the large overweight to technology and the mega-cap names that influence daily moves – providing you with a good idea of what’s going on under the hood.
Below is a daily chart of $RSP showing a head and shoulders pattern that formed over the summer – showing exhaustion in the underlying uptrend from the March 2022 lows – with the key development occurring on September 21st (bubbled in grey below), the day after the FOMC meeting when RSP resolved decidedly lower below the neckline (horizontal black dotted line).
The “average” stock is down -11.7% from the July highs, with momentum (Relative Strength Index) showing the latest move is now oversold – more on that in yesterday’s note.
$137-$139 presents a logical tactical support level, representing the March 2023 bottom and a 61.8% Fibonacci retracement of the October 2022 lows to July 2023 highs.
If RSP cannot hold this general cloud level, then expect more bearish developments in the risk assets to follow.
Source: The Weekly Grind
2023 corporate bond issuance
Even with higher interest rates and elevated rate volatility, 2023 corporate bond issuance is going to pass 2022’s volume, which is a positive sign of investor appetite and corporate health.
Source: S&P Global Market Intelligence
Resurgence in labor movements
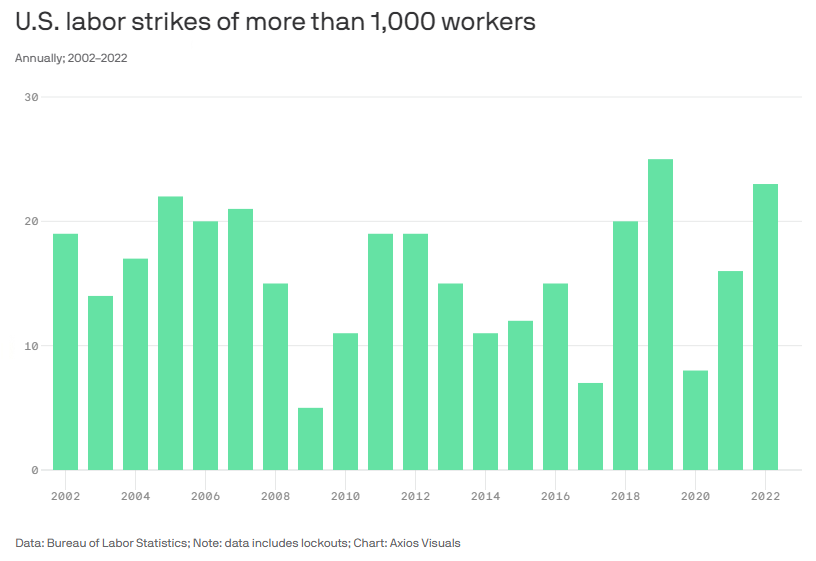
This week over 75,000 Kaiser Permanente employees are striking, the largest healthcare strike in history and causing interruptions for one of the nation's most important healthcare systems.
This latest worker uprising is adding to the unionized labor disturbances that have swept across seemingly every sector over the last few years. Between 2022 and August of this year, there have been 42 work stoppages involving 1,000 or more strikers.
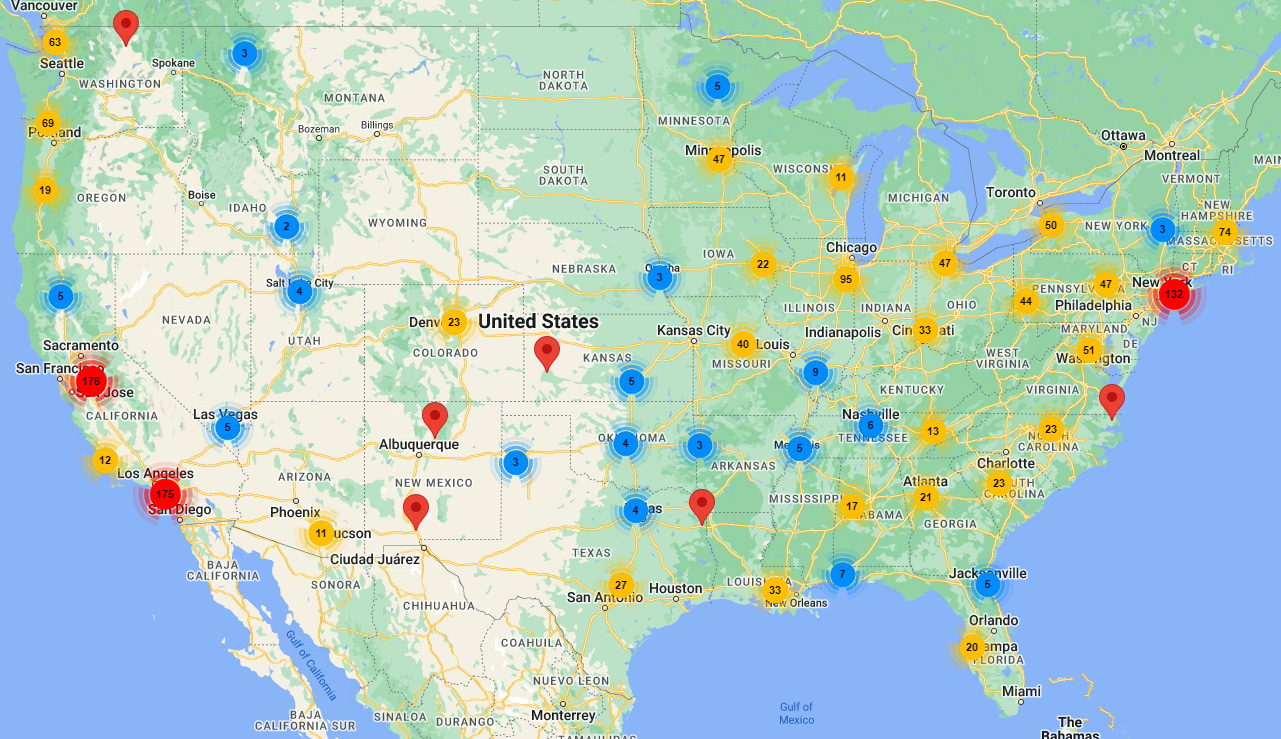
Currently, Cornell University is tracking 984 labor actions across 1543 locations – see map below.
Meanwhile, the United Auto Workers (UAW) have been on strike since September 15 versus Detroit’s Big 3, with certain estimates bringing the strike’s total cost over the 21 impacted days to ~$4-8 billion. The automakers have established additional lines of credit over the past couple days to shore up liquidity, a sign that it’s buckling in for a protracted work stoppage.
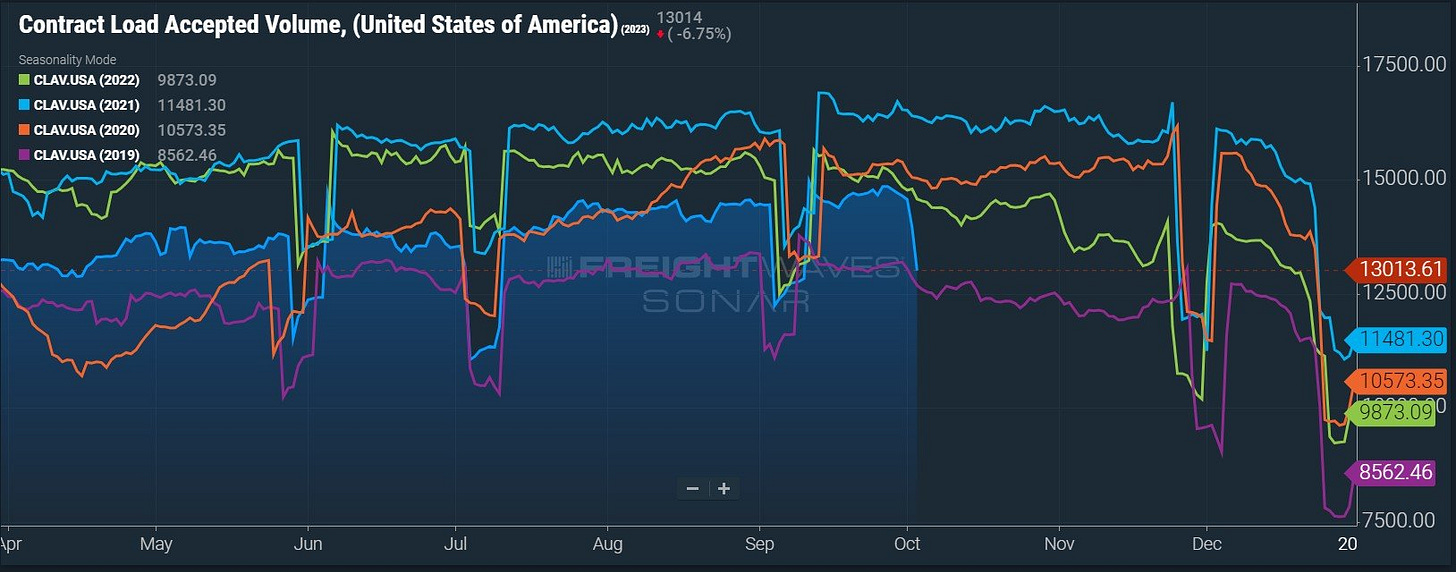
Remember, these strikes don’t just impact the companies and workers themselves, but result in many downstream effects. For example, the auto industry is a significant contributor to the nation’s freight economy, where trucking volumes are down 12%!
And Mary Barra, CEO of General Motors, had this to say on the economic toll: “For every General Motors job, there’s six others in the economy that depend on us running.”
These latest developments follow the Writers Guild of America (WGA) and Screen Actors Guild (SAG) strikes that lasted roughly 150 days, impacted 175,000 people, and cost upwards of $5-6 billion.
Other recent notable movements include The Culinary Workers Union and Bartenders Union impacting the Las Vegas casinos, flight attendant negotiations from The Association of Professional Flight Attendants (APFA), and localized CVS pharmacists walking out in Missouri.
So, what’s the impact of these strikes?
While the unionized share of the workforce is small at less than 10%, recent strikes and reports of unions winning/demanding large wage increases have fueled concerns that wage growth could reaccelerate and boost inflation.
Source: AP, Goldman Sachs, Axios, Detroit Free Press, Cornell School of Industrial and Labor Relations (ILR), CNN, Freight Waves, Freight Alley
That’s all for today.
Blake
Welcome to The Sandbox Daily, a daily curation of relevant research at the intersection of markets, economics, and lifestyle. We are committed to delivering high-quality and timely content to help investors make sense of capital markets.
Blake Millard is the Director of Investments at Sandbox Financial Partners, a Registered Investment Advisor. All opinions expressed here are solely his opinion and do not express or reflect the opinion of Sandbox Financial Partners. This Substack channel is for informational purposes only and should not be construed as investment advice. The information and opinions provided within should not be taken as specific advice on the merits of any investment decision by the reader. Investors should conduct their own due diligence regarding the prospects of any security discussed herein based on such investors’ own review of publicly available information. Clients of Sandbox Financial Partners may maintain positions in the markets, indexes, corporations, and/or securities discussed within The Sandbox Daily. Any projections, market outlooks, or estimates stated here are forward looking statements and are inherently unreliable; they are based upon certain assumptions and should not be construed to be indicative of the actual events that will occur.


