Risk appetite, plus stocks bottom first, breadth improves, energy, and history on 2023's side
The Sandbox Daily (1.30.2023)
Welcome, Sandbox friends.
Today’s Daily discusses investors warming up to risk, stocks bottom before fundamentals, a broad look at market breadth, the disconnect between Energy stocks and commodities, and history points to a more favorable market environment in 2023 (vs. 2022).
Let’s dig in.
Markets in review
EQUITIES: Dow -0.77% | S&P 500 -1.30% | Russell 2000 -1.35% | Nasdaq 100 -2.09%
FIXED INCOME: Barclays Agg Bond -0.27% | High Yield -0.55% | 2yr UST 4.236% | 10yr UST 3.542%
COMMODITIES: Brent Crude -2.07% to $84.87/barrel. Gold -0.36% to $1,938.6/oz.
BITCOIN: -4.49% to $22,726
US DOLLAR INDEX: +0.29% to 102.221
CBOE EQUITY PUT/CALL RATIO: 0.51
VIX: +7.73% to 19.94
Risk appetite returning
During a bull market, investors move further out on the risk curve in an effort to generate alpha, which refers to an investment's ability to outperform the market.
The logic is simple: If the broad market is rising, the optimal strategy is to own the assets that are rising the fastest to have a chance at outperforming the market. This is commonly referred to the "high beta factor" in Wall Street lingo.
The chart below overlays the S&P 500 (SPY) with a ratio of the S&P 500 High Beta ETF (SPHB) versus the S&P 500 Low Volatility ETF (SPLV).
High beta stocks are risk-on assets and tend to outperform during bull markets. Meanwhile, low volatility stocks are more defensive in nature, and for this reason are more likely to outperform during bear markets. As such, the ratio rises and falls with the broader market and provides us valuable information regarding risk appetite and what kind of market environment investors are positioning for.
Seeing the ratio hit its highest level since April of last year can only be viewed as a positive development for bullish investors. As long as these new highs hold, equity markets could follow higher over the coming weeks.
Source: All Star Charts
Stocks bottom first
Stocks usually bottom before earnings-per-share growth (EPS), jobs, and gross domestic product (GDP) start to improve.
We’ve seen cycles time and time again, although notably it didn't work during the Tech bubble where the earnings decline preceded the equity market decline and there was barely a recession at all.
In fact, equities typically bottom 6-9 months before earnings.
So, it’s much more likely than not that a lot of the incoming economic data will worsen in the coming months as the lagged effects from hiking interest rates from 0% to 4.25-4.50% start to make its way through the economy, even if the stock market is showing strength.
Bottom line: the stock market is a forward-looking mechanism in which stocks sniff out better times and rally in the face of bad news. It stops going down while GDP, employment, and earnings deteriorate.
Source: JPMorgan, Rate of Return
Market breadth improving
The reason we watch breadth is pretty simple: the more stocks that participate in a trend, the stronger that trend is. A handful of large stocks can drive cap-weighted index prices higher (or lower) by themselves – and sometimes they can do it for longer than most expect (i.e. FAANG) – but ultimately a trend becomes more durable and well established when markets see a broadening out in participation. Let’s discuss two breadth metrics.
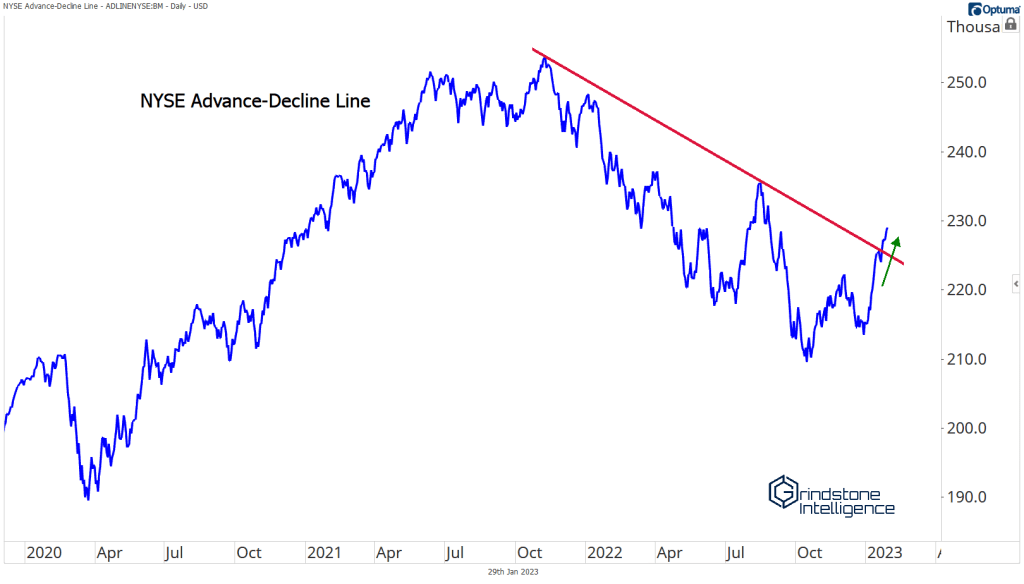
The cumulative advance-decline line might be the most well-known of breadth indicators. Its calculation is fairly simple: an index is created by cumulatively adding or subtracting the net of rising vs. falling issues for each trading day. If a greater number of stocks are rising than falling, the advance-decline line rises, and vice versa. No indicator is infallible, but the NYSE Advance-Decline line has reliably diverged from prices before several major stock market selloffs. Its track record is less reliable during bear market recoveries, but that's not a reason to ignore the A/D line entirely – it can still offer useful information. Today, the A/D line for the NYSE is at its highest level since last August 2022, and it's broken the downtrend line from the 2021 highs. At the very least, that's evidence of the downtrend in advances weakening.
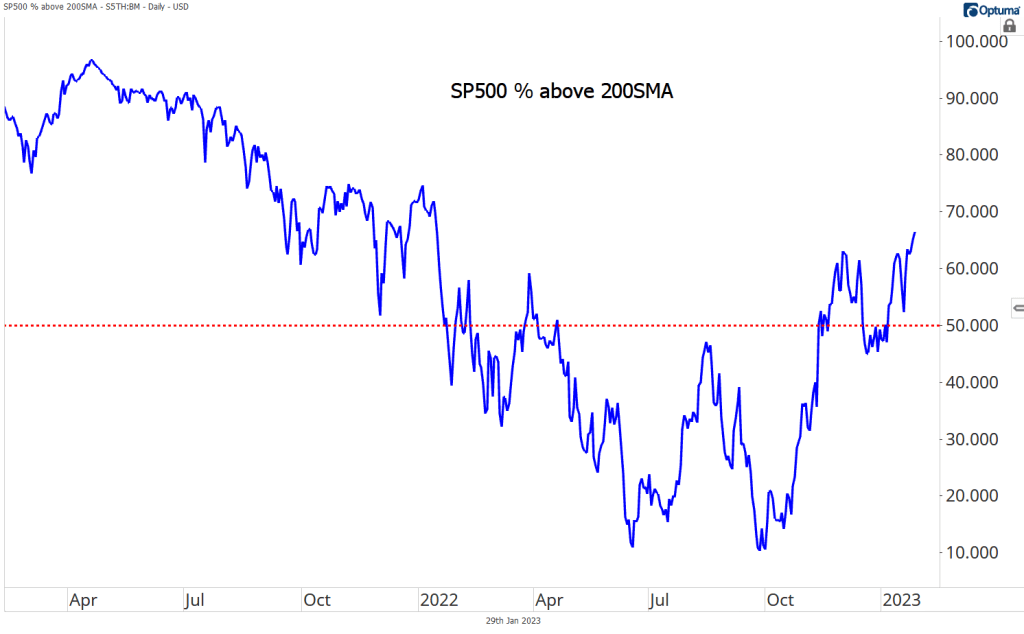
Advancers are outpacing decliners, as evidenced above. And that's led to more stocks being in uptrends. Among the simplest ways to define whether something is generally rising or falling is to compare it to a moving average price – a stock higher than its average price over the preceding 200 days can be assumed to be trending higher, and vice versa. Today, two-thirds of issues in the S&P 500 are above their 200-day moving average, the highest number in over a year.
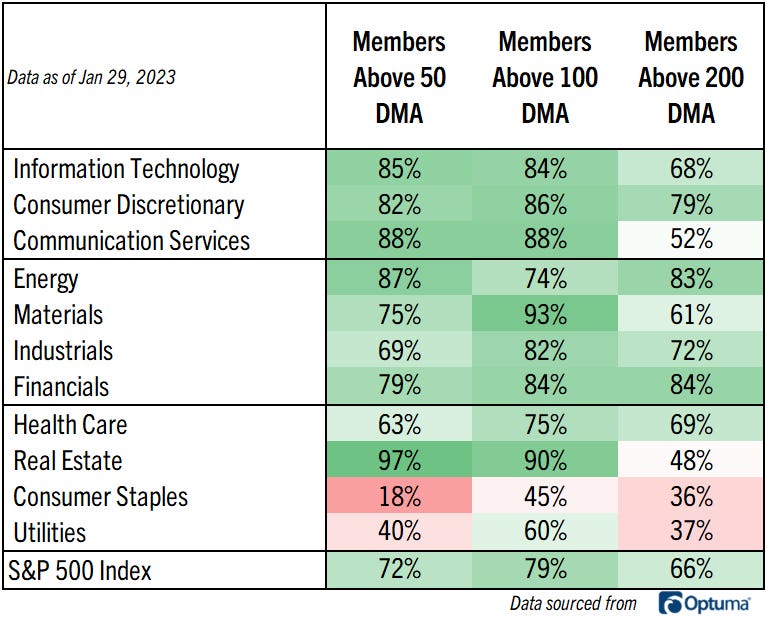
And here is the sector breakout across different time-frames, suggesting nearly all sectors are participating in this recent rally:
The continued expansion in market breadth is surely constructive for the bulls, but it may be premature to call an official end to the bear market that sank stocks in 2022.
Source: Grindstone Intelligence
The disconnect between Energy stocks and commodities
Even as the Energy sector trades within ~5% of a 52-week high, natural gas and crude oil are in vicious drawdowns.
Crude is down -36% from its closing 52-week high, representing a deeper drawdown (on a percentage basis) than 88% of all other trading days since 1992.
For natural gas, prices are even deeper in the hole. After first dropping below $3 last week, the bottom fell out today as prices dropped below $2.75 for the first time since April 2021. With front-month futures more than 71% below their 52-week high, the current drawdown is deeper than 98% of all previous trading days since 1992.
What makes the current environment unique is that while both crude oil and natural gas are down sharply from their 52-week highs, the S&P 500 Energy sector's drawdown has been relatively tame – the sector is off just ~4% from its 52-week high, and only 36% of all trading days since 1992 have been closer to a 52-week high.
For some perspective, going back to 1992, in prior periods when natural gas has been 70% or more below its 52-week high, the Energy sector's median drawdown from a 52-week high has been 21.2%. When crude oil has been 35% or more below its 52-week high, the Energy sector's median distance from a 52-week high has been 26.5%.
In other words, it's extremely uncommon to see the Energy sector trade so close to a 52-week high while the energy-related commodities are in such steep drawdowns.
Source: Bespoke Investment Group
One simple graphic
Sifting through nearly 100 years of data, 2023 is setting up to be better environment for investors than 2022.
Source: Ken Fisher
That’s all for today.
Blake
Welcome to The Sandbox Daily, a daily curation of relevant research at the intersection of markets, economics, and lifestyle. We are committed to delivering high-quality and timely content to help investors make sense of capital markets.
Blake Millard is the Director of Investments at Sandbox Financial Partners, a Registered Investment Advisor. All opinions expressed here are solely his opinion and do not express or reflect the opinion of Sandbox Financial Partners. This Substack channel is for informational purposes only and should not be construed as investment advice. Clients of Sandbox Financial Partners may maintain positions in the markets, indexes, corporations, and/or securities discussed within The Sandbox Daily.


