S&P 500 breadth measure pushes the technical indicator towards all-time highs
The Sandbox Daily (6.23.2023)
Welcome, Sandbox friends.
Today’s Daily discusses:
S&P 500 advance-decline line pushing up towards all-time highs
recent market weakness coming from the same names
leading indicators point to slowing economic activity
closures of local bank branches on the rise
Friday thought exercise
a brief recap to snapshot the week in markets
It’s summer Friday - hope everyone has a great weekend !!
Let’s dig in.
Markets in review
EQUITIES: Dow -0.65% | S&P 500 -0.77% | Nasdaq 100 -1.00% | Russell 2000 -1.44%
FIXED INCOME: Barclays Agg Bond +0.30% | High Yield -0.17% | 2yr UST 4.752% | 10yr UST 3.737%
COMMODITIES: Brent Crude +0.23% to $74.31/barrel. Gold +0.31% to $1,929.6/oz.
BITCOIN: +2.72% to $30,953
US DOLLAR INDEX: +0.47% to 102.868
CBOE EQUITY PUT/CALL RATIO: 0.64
VIX: +4.11% to 13.44
Quote of the day
“Don't judge each day by the harvest you reap but by the seeds you plant.”
- Robert Louis Stevenson
S&P 500 advance-decline line pushing up towards all-time highs
The story of 2023 is unequivocally market breadth, or lack thereof.
But, as Steven Strazza of All Star Charts humorously postures, “breadth is so bad that the S&P 500 advance-decline line is about to make new all-time highs.”
This matters because the stock market is a market of stocks. Throughout history, the Adv/Dec line leads the overall index higher.
Source: All Star Charts
Recent weakness coming from the same names
The S&P 500 index has pulled back just over 2% since its closing high for the year on June 15th, but the decline only brings us back to where we were trading early last week. Much ado about nothing.
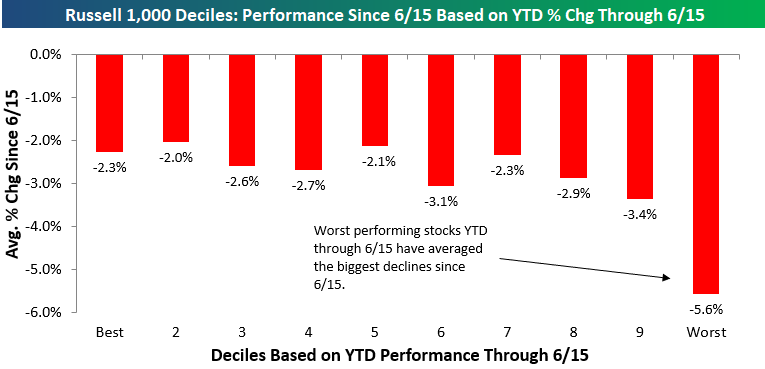
So, what is interesting? It’s been the worst performers year-to-date up to 6/15 that are leading the declines right now. Many would have expected it the other way around, with the biggest winners (like tech) pulling back the most to consolidate their monster gains.
Here are the stocks in the Russell 1000 – used here because it’s a broader representation of stocks – ranked in descending order of YTD performance deciles. Notice the worst 3 performing groups are leading the recent weakness lower.
Source: Bespoke Investment Group
Leading indicators point to slowing economic activity
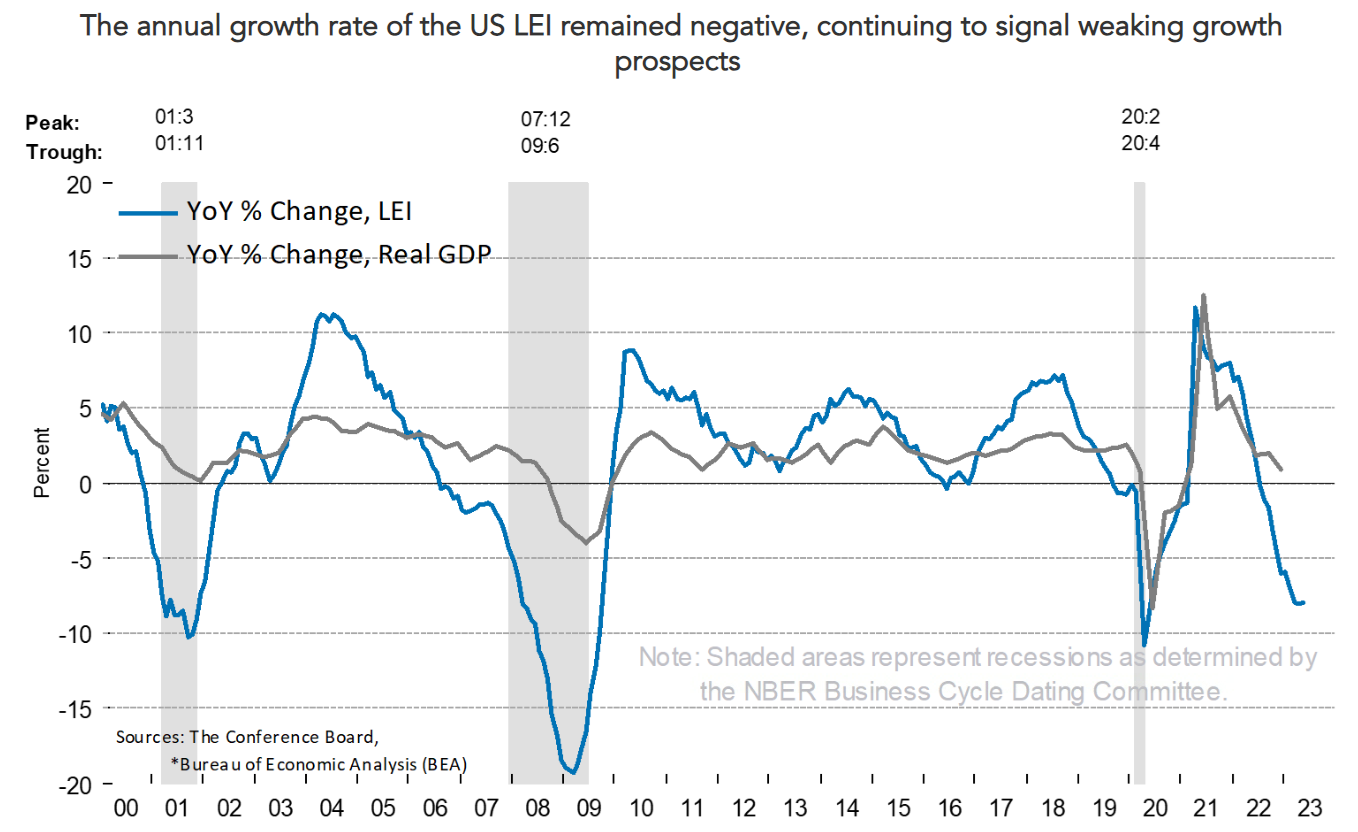
The U.S. Leading Economic Indicators (LEI) index, compiled by the Conference Board, sank -0.7% in May. The decline was the 14th contraction in a row.
Declines of this magnitude have always been associated with recession.
The Conference Board publishes leading, coincident, and lagging indexes designed to signal peaks and troughs in the business cycle for major global economies. Many economists and investors track this measure closely.
As shown below, such a streak of consecutive monthly declines has led to 7 of the last 8 recessions; the only instances we’ve had this many consecutive declines were the recessions that started in 1973 and 2007. The pandemic-related recession is the outlier, but given the unexpected and somewhat random nature of the pandemic, it is not surprising that this indicator or any other leading indicator could not forecast it.
The rate of decline in the LEI and the weak indicator breadth are historically consistent with falling economic activity. The Conference Board expects further economic softness in the coming months and a recession starting in the 2nd half of 2023.
Clearly the forward-looking indicators suggest enduring, widespread weakness across the economy. While no forecasting system is perfect, this one has a pretty good track record.
Source: The Conference Board, Ned Davis Research, Liz Ann Sonders
Closures of local bank branches on the rise
6,100 U.S. bank branches were closed between 2019 and 2022, the highest number of closures over a three-year period in history.
And what’s worse? Banks are expected to continue cutting branch costs to save on real estate, labor costs, and the required equipment to run daily operations. Customers are routinely relying more on tech and online providers for routine banking services.
“The future of everything in banking is digital,” CEO Richard Fairbank of Capital One told analysts on a call in April.
Source: Wall Street Journal
Friday thought exercise
As we approach the weekend, it is time to ask yourself: which of these lines do you typically participate in?
The people in the left line are typically much happier, live longer, and are a lot more fun to be around.
Source: Journal of Discoveries
The week in review
Talk of the tape: Market risk remains to the upside. Soft-landing expectations are the key driver of the bullish narrative. Disinflation traction, which has been in the headlines again this week, cited as another tailwind. Consumer resilience, although showing some signs of fatigue, is another bright spot. The early Treasury General Account (TGA) rebuild has not been a big drag on reserves and liquidity. The AI secular growth tailwind another bullish talking point, while the last couple of weeks have seen a notable improvement in market breadth. Elsewhere, China is ramping up stimulus measures.
Some concerns linger about overbought conditions, dampened sentiment, and positioning tailwinds. The Federal Reserve and European Central Bank takeaways this week leaned hawkish, especially Chairman Jerome Powell’s testimony in Washington, D.C. this week. Some remain very concerned the Fed is too focused on lagging indicators and risks making another policy mistake.
Stocks: All major market indexes ended lower given this week’s Federal Reserve Chairman Powell’s Congressional testimony. Even as inflationary conditions in the U.S. are showing steady improvement following the Federal Reserve’s hawkish policy stance, core inflation is still high and should remain a priority for the Federal Reserve to solve. The S&P 500 and Nasdaq Composite Indexes are snapped 5- and 8-week winning streaks, respectively.
Bonds: The Bloomberg Aggregate Bond Index finished lower this week given Powell’s congressional testimony. High-yield credit also had a negative week on the back of this week’s market selloff, yet continues to be a leader in the fixed income asset class year-to-date.
June Treasury auction demand has been mixed on coupon securities but still solid with Treasury Bills (T-Bills). So far this month, the Treasury Department has issued over $600 billion in new debt, most of which has been shorter maturity T-Bills, and there has been very little impact on prices or liquidity. Despite the still elevated auction schedule, we do not think Treasury issuance will be disruptive to fixed income markets.
Commodities: Energy prices ended mixed this week. Traders are concerned about oil prices, triggered by the interest rate rises in the EU leading to prospects for lower growth. In addition, disappointing stimulus numbers out of China are worrisome given the nation’s demand for energy. The major metals (gold, silver, and copper) finished the week lower. Gold prices posted their worst week in four and a half months amid Powell’s testimony this week amid the threat of interest rate increases.
Source: Dwyer Strategy, LPL Research
That’s all for today.
Blake
Welcome to The Sandbox Daily, a daily curation of relevant research at the intersection of markets, economics, and lifestyle. We are committed to delivering high-quality and timely content to help investors make sense of capital markets.
Blake Millard is the Director of Investments at Sandbox Financial Partners, a Registered Investment Advisor. All opinions expressed here are solely his opinion and do not express or reflect the opinion of Sandbox Financial Partners. This Substack channel is for informational purposes only and should not be construed as investment advice. Clients of Sandbox Financial Partners may maintain positions in the markets, indexes, corporations, and/or securities discussed within The Sandbox Daily.


