S&P 500 performance after the final hike, plus seasonal trends, yields, hedge fund positioning, and home sales
The Sandbox Daily (11.21.2023)
Welcome, Sandbox friends.
Today’s Daily discusses:
S&P 500 market performance following the final rate hike
seasonal trends
comparing bond and equity yields
hedge fund positioning
existing home sales fall to 13-year low
Let’s dig in.
Markets in review
EQUITIES: Dow -0.18% | S&P 500 -0.20% | Nasdaq 100 -0.58% | Russell 2000 -1.32%
FIXED INCOME: Barclays Agg Bond +0.10% | High Yield +0.13% | 2yr UST 4.881% | 10yr UST 4.396%
COMMODITIES: Brent Crude +0.16% to $82.45/barrel. Gold +0.98% to $2,020.1/oz.
BITCOIN: -1.75% to $36,763
US DOLLAR INDEX: +0.15% to 103.592
CBOE EQUITY PUT/CALL RATIO: 0.53
VIX: -0.45% to 13.35
Quote of the day
“The problem with trying to outperform through concentration is the probabilities are stacked against you. For every Buffett, there are thousands of other investors who tried and failed to hold concentrated positions. We never hear about the losers. Diversification not only helps manage risk in a portfolio but also increases your return in the stock market by giving you more opportunity to own the biggest winners.”
- Ben Carlson, Power Law in the Stock Market
S&P 500 performance following last rate hike
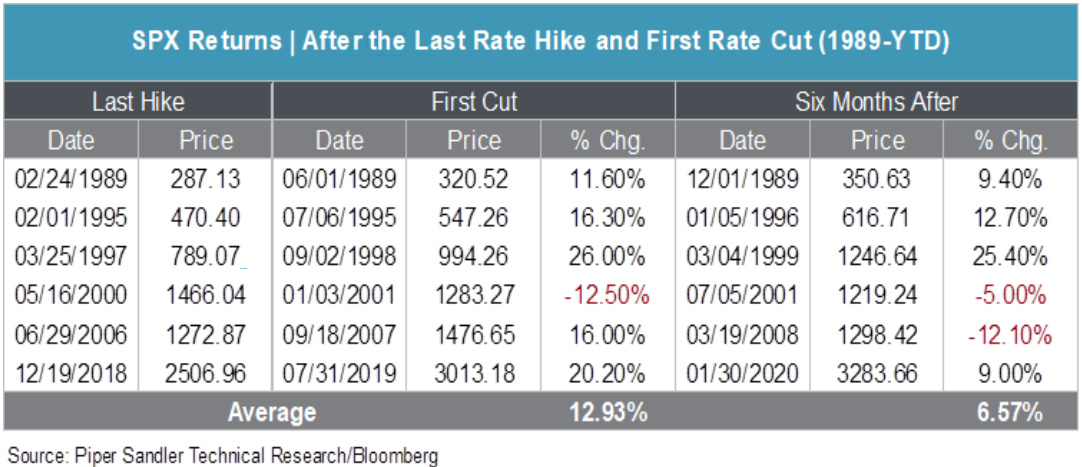
With the prospect of the Federal Reserve being done with its rate hikes, Piper Sandler research shows that since 1989, the S&P 500 index has rallied an average ~13% from the last hike to the first cut.
On average, the first cut occurred approximately 8.2 months after the last rate hike. Six months after the first cut, the SPX was higher 67% of the time, with an average return of 6.57%.
Source: Piper Sandler
Seasonal trends
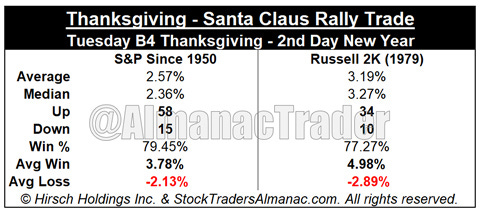
The Thanksgiving to Santa Claus Rally – the Tuesday before Thanksgiving to the 2nd trading day of the New Year – starts today.
Per the Sock Trader’s Almanac, the S&P 500 index is up 79.45% of the time since 1950 – a very high win ratio – averaging a gain of +2.57%.
This seasonal trend combines the best three month-span (November-January), the Santa Claus Rally, and the January Effect.
Again, this information is not necessarily used to add or remove a trade/risk, but we use these tools to put the environment into context, similar to sentiment or positioning data.
Source: Jeffrey Hirsch
Comparing bond and equity yields
The cost of capital across credit-based instruments have risen in lockstep with one another, tracking the underlying driver that is the Federal Funds Rate.
10-year U.S. Treasurys have moved the least of the group, reflecting their risk-free status being government bonds backed by the full faith and credit of the United States government. On the contrary, High Yield has jumped the most due to higher perceived credit risks that accompany higher rates.
Meanwhile, the equity earnings yield remains remarkably unremarkable.
Source: Jurrien Timmer
Hedge fund positioning
Every quarter, the Goldman Sachs portfolio strategy team analyses hedge fund holdings to gain insight into what the hedgies are up to. The most recent report surveyed the holdings of 735 hedge funds with $2.4 trillion of gross equity positions ($1.6T long and $0.8T short) at the start of Q4 per various 13-F filings.
What did we learn? Concentration within the typical hedge fund portfolio and crowding across fund portfolios both increased during the 3rd quarter.
The typical hedge fund holds 70% of its long portfolio in its top 10 positions, matching the highest concentration on record outside of 4Q18 – see chart below, bottom left.
The Goldman Sachs Hedge Fund Crowding Index – a proprietary metric tracking overlap of positions across portfolios – registered the most crowding across hedge fund long portfolios in their 22-year data history – see chart below, bottom right.
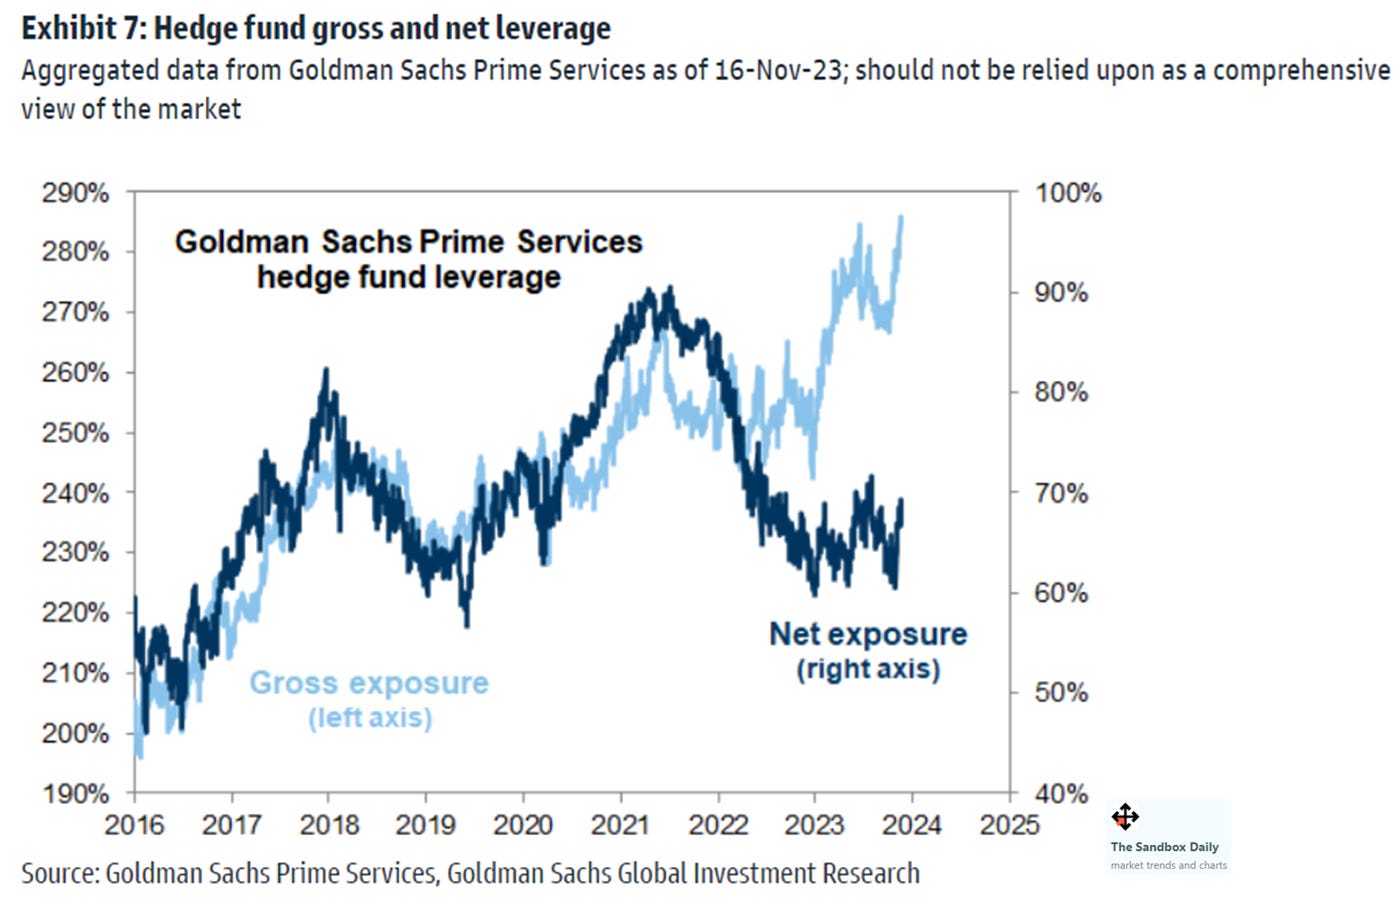
While funds have lifted their net exposures only modestly year-to-date, gross exposures currently register at the highest level on record.
Elsewhere, we learned that short interest in the typical stock remains low as funds have increasingly hedged their portfolio using macro products like ETFs and futures rather than single stock shorts.
Finally, because hedge funds have the ability to outright short stocks in the way a traditional mutual fund or ETF cannot, it’s always interesting to review the stocks with the largest changes (up or down) in short interest:
It’s important to always remember these 13-F SEC filings are dated as of the most recent quarter-end (not timely) and many funds actively engage in window-dressing (not actionable).
Source: Goldman Sachs Global Investment Research
Existing home sales fall to 13-year low
Existing home sales fell 4.1% in October from the prior month to a 3.79 million unit annual rate, worse than consensus estimates and dropping to its slowest sales pace since August 2010.
Sales have fallen in 19 of the past 21 months as high mortgage rates, elevated home prices, and low housing inventory have discouraged potential buyers.
Existing home sales in October were 14.6% lower than they were a year earlier, the 26th consecutive YoY decline – the longest down streak since 2007-2009.
Source: Ned Davis Research, Bloomberg, Charlie Bilello
That’s all for today.
Blake
Welcome to The Sandbox Daily, a daily curation of relevant research at the intersection of markets, economics, and lifestyle. We are committed to delivering high-quality and timely content to help investors make sense of capital markets.
Blake Millard is the Director of Investments at Sandbox Financial Partners, a Registered Investment Advisor. All opinions expressed here are solely his opinion and do not express or reflect the opinion of Sandbox Financial Partners. This Substack channel is for informational purposes only and should not be construed as investment advice. The information and opinions provided within should not be taken as specific advice on the merits of any investment decision by the reader. Investors should conduct their own due diligence regarding the prospects of any security discussed herein based on such investors’ own review of publicly available information. Clients of Sandbox Financial Partners may maintain positions in the markets, indexes, corporations, and/or securities discussed within The Sandbox Daily. Any projections, market outlooks, or estimates stated here are forward looking statements and are inherently unreliable; they are based upon certain assumptions and should not be construed to be indicative of the actual events that will occur.


