S&P 500 resistance line, plus U.S. debt, global risks, the dollar, and China's population in decline
The Sandbox Daily (1.17.2023)
Welcome, Sandbox friends.
Today’s Daily discusses the S&P 500 index facing a critical resistance line, servicing the U.S. debt burden, the biggest global risks of 2023 (per the World Economic Forum), more bullish evidence for stocks, and China’s population is in decline.
Let’s dig in.
Markets in review
EQUITIES: Nasdaq 100 +0.14% | Russell 2000 -0.15% | S&P 500 -0.20% | Dow -1.14%
FIXED INCOME: Barclays Agg Bond -0.18% | High Yield -0.34% | 2yr UST 4.205% | 10yr UST 3.553%
COMMODITIES: Brent Crude +3.07% to $86.70/barrel. Gold -0.55% to $1,911.2/oz.
BITCOIN: +0.03% to $21,178
US DOLLAR INDEX: +0.18% to 102.383
CBOE EQUITY PUT/CALL RATIO: 0.69
VIX: +5.50% to 19.36
Make or break time
The S&P 500 has rallied +11.57% off the October lows and now sits at an important inflection point – the downward sloping 200-day moving average (DMA).
This is a commonly used indicator that helps smooth out the stock market’s long-term trend and is often looked at as a potential area of reflection for prices. Like every tool, the moving average is far from perfect but it does carry merit among market technicians.
The S&P 500 failed to break above this trendline several times in 2022. So, for the current cycle, the 200-DMA has acted as an area of resistance and a worthy area to track selling pressure.
Traders and investors will be watching if this bear market rally can continue. A (clean) breakout above this resistance level would lend more strength to the bulls staying long on this rally, while a fakeout/breakdown would suggest the bears have retaken control and the path of least resistance is lower.
For now, stocks remain vulnerable until this key resistance level is broken convincingly.
Source: Topdown Charts
Servicing the U.S. debt burden
Total outstanding government debt currently stands around $31 trillion and that number will likely increase this year and the next, as it usually does.
The Fed has stated that interest rates are likely going to be at these elevated levels for some time – the “higher for longer” narrative that Federal Reserve Chairman Jerome Powell and his FOMC committee members keep pushing. “Higher for longer” will certainly impact the costs associated with servicing government debt.
Questions are beginning to pop up with regards to the debt service burden that our federal government faces. Namely, how can we afford to keep raising rates?
Total interest payments on the government’s debt is projected to skyrocket – the annual tab will be roughly $1.2 trillion with the Federal Funds Rate over 4%!!
Servicing our own debt load now costs more than our defense budget ($857 billion).
Source: St. Louis Fed, Congressional Budget Office, QE Infinity, David Bahnsen
Biggest global risks of 2023
The profile of risks facing the world is evolving constantly.
Events like last year’s invasion of Ukraine can send shockwaves through the system, radically shifting perceptions of the biggest risks we face. Add in inflation and an energy crisis, it’s understandable why people are concerned at the outlook in 2023.
The World Economic Forum (WEF) just released their annual report, the Global Risks Report. It provides an overview of the most pressing global risks that the world is facing, or perceives to be facing, as identified by experts and decision-makers.
These risks are grouped into five general categories: economic, environmental, geopolitical, societal, and technological.
Not surprisingly, the top risks are related to issues that impact a wide variety of people, such as the rising cost of living and inflation.
Source: World Economic Forum, Visual Capitalist
More bullish evidence for stocks
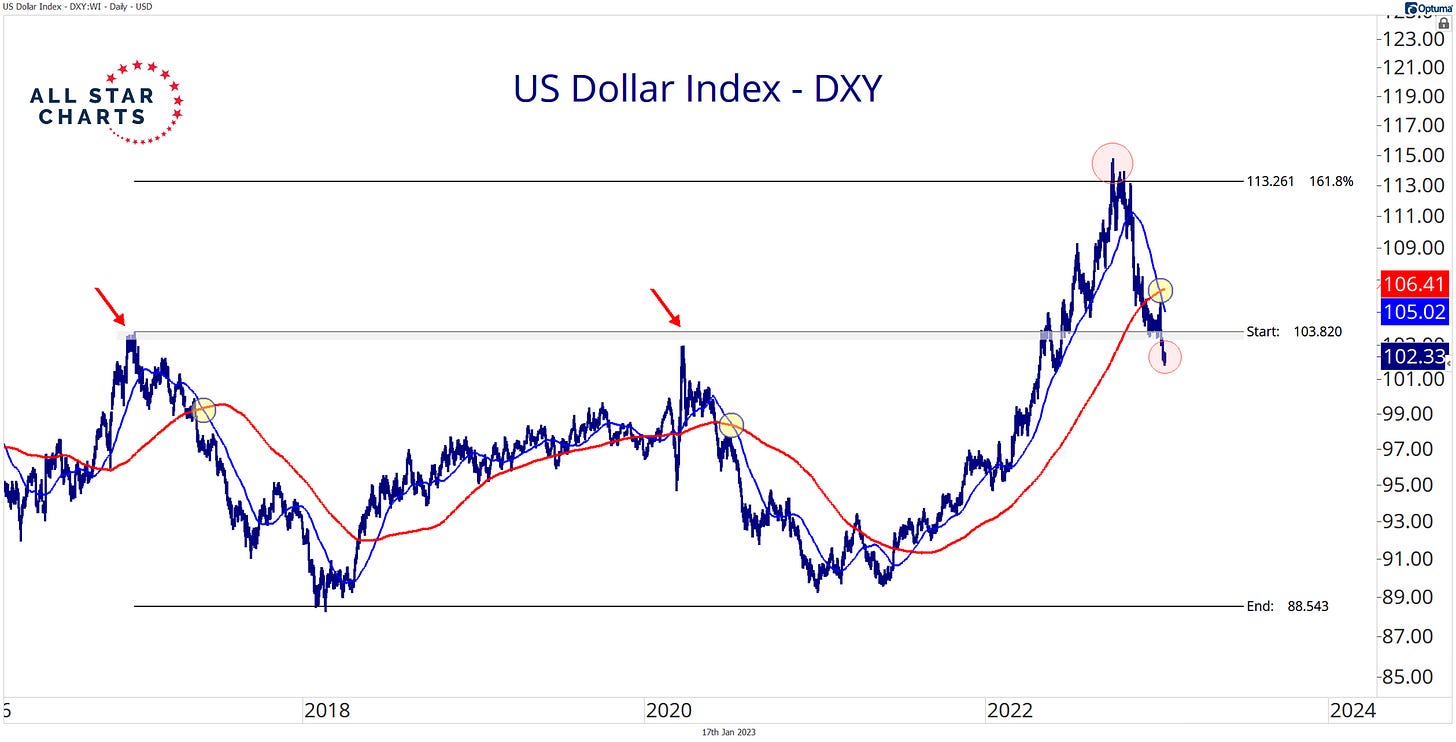
The U.S. Dollar Index (DXY) posted a death cross last week. This is when the 50-day simple moving average (SMA) undercuts the longer-term 200-day SMA.
This could be taken as confirmation of the reversal in the dollar, which has historically proven bullish for U.S. stocks.
Since 1980, the U.S. Dollar Index has registered 28 death crosses. 6 months and 12 months out from a crossover signal, the S&P 500 historically provides an impressive hit rate with positive gains occurring 85.19% of the time.
The study highlights a bullish environment for stocks following a significant bullish-to-bearish trend reversal in the U.S. dollar – such as the one that just occurred.
Source: All Star Charts
China’s population on the decline
China has hit an inflection point.
China’s population dropped to 1.412 billion in 2022, from 1.413 billion in 2021. It was the first decline since the early 1960s.
China’s birthrate is slowing. What’s more, declining populations are historically a headwind for the political and economic well-being of a sovereign nation.
Source: National Bureau of Statistics of China, Wall Street Journal, Sandbox Financial Partners
That’s all for today.
Blake
Welcome to The Sandbox Daily, a daily curation of relevant research at the intersection of markets, economics, and lifestyle. We are committed to delivering high-quality and timely content to help investors make sense of capital markets.
Blake Millard is the Director of Investments at Sandbox Financial Partners, a Registered Investment Advisor. All opinions expressed here are solely his opinion and do not express or reflect the opinion of Sandbox Financial Partners. This Substack channel is for informational purposes only and should not be construed as investment advice. Clients of Sandbox Financial Partners may maintain positions in the markets, indexes, corporations, and/or securities discussed within The Sandbox Daily.


