Seasonal trends into year-end, plus systematic traders and the 200-DMA
The Sandbox Daily (10.31.2023)
Welcome, Sandbox friends.
Today’s Daily discusses:
seasonal trends constructive into year-end
systematic traders hold stock positions lightly
what’s with the 200-DMA?
Happy Halloween to all – have a wonderful and safe evening! My kids are pumped!!
Let’s dig in.
Markets in review
EQUITIES: Russell 2000 +0.91% | S&P 500 +0.65% | Nasdaq 100 +0.52% | Dow +0.38%
FIXED INCOME: Barclays Agg Bond -0.06% | High Yield +0.26% | 2yr UST 5.083% | 10yr UST 4.922%
COMMODITIES: Brent Crude -0.05% to $87.42/barrel. Gold -0.63% to $1,993.2/oz.
BITCOIN: +0.84% to $34,634
US DOLLAR INDEX: +0.54% to 106.696
CBOE EQUITY PUT/CALL RATIO: 0.68
VIX: -8.15% to 18.14
Quote of the day
“Despite the unequivocal truth that investor behavior is a better predictor of wealth creation than fund selection or market timing, no one dreams about not panicking, making regular contributions, and maintaining a long-term focus..”
- Dr. Daniel Crosby, The Laws of Wealth
Seasonal trends constructive into year-end
The market has been a lousy place for long investors since July when the New Highs list peaked, longer-dated yield moved up in a near-straight line, and the U.S. dollar started marching higher.
Looking forward into year-end, seasonal tailwinds are supportive of equities in both November and December.
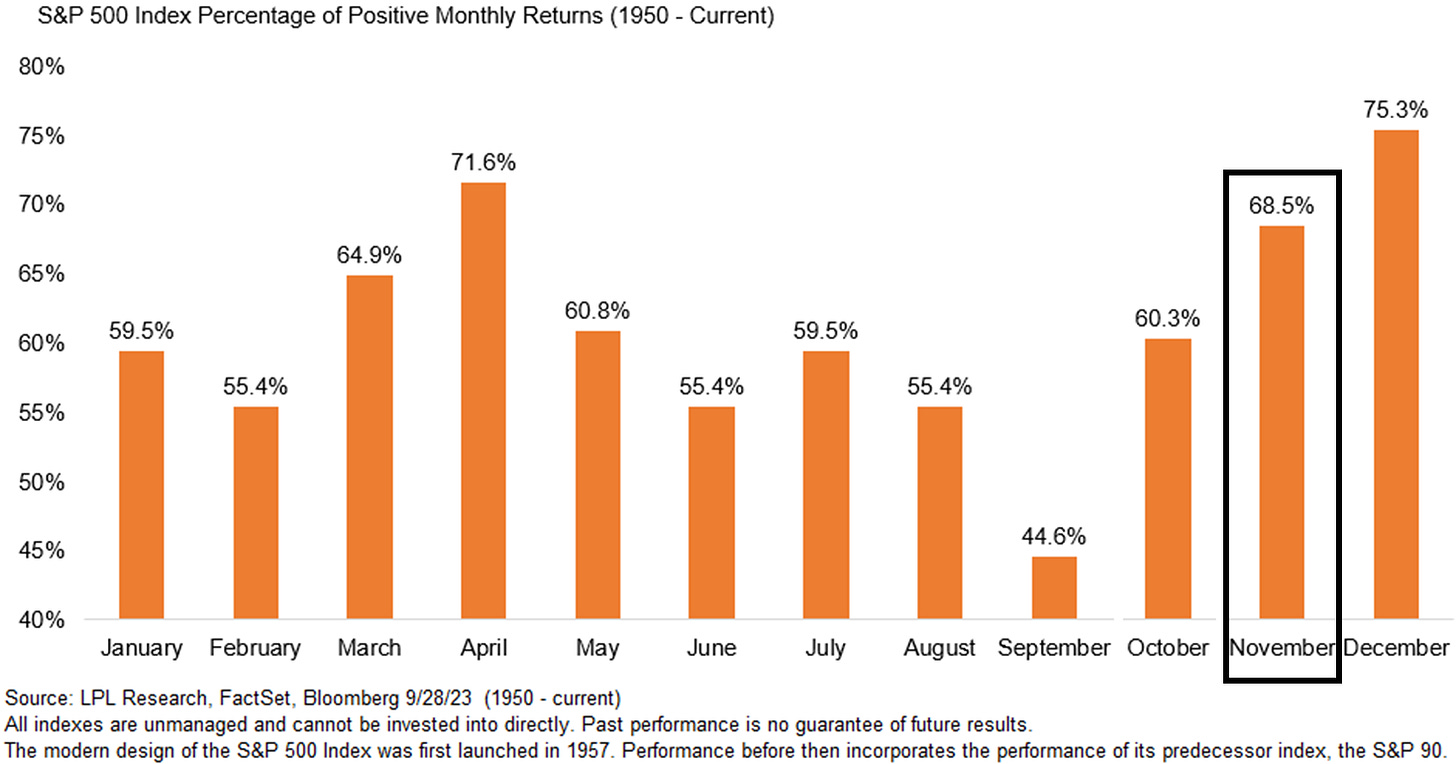
Since 1950, the proportion of positive monthly returns for November is 68.5%, while December is higher 75.3% of the time.
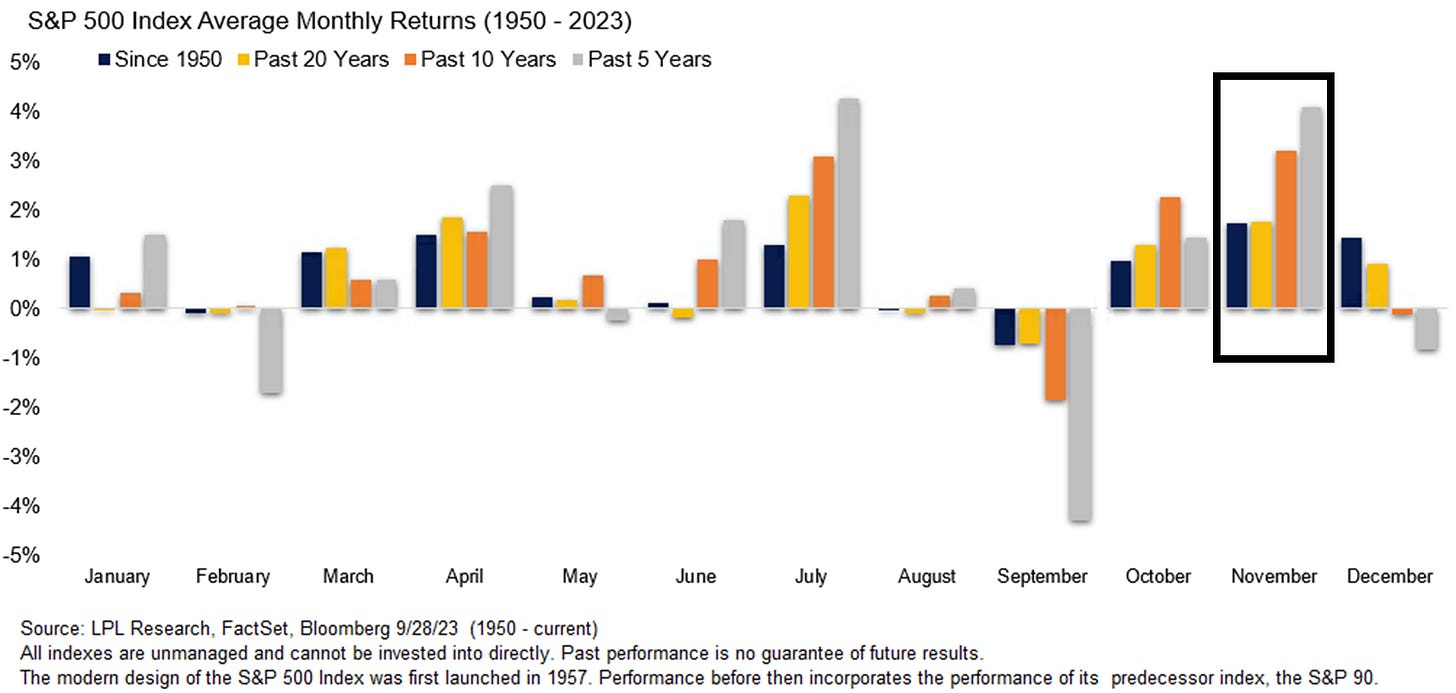
No matter what time frame you choose – past 5, 10, 20, or ~75 years – November is a strong month historically for equities.
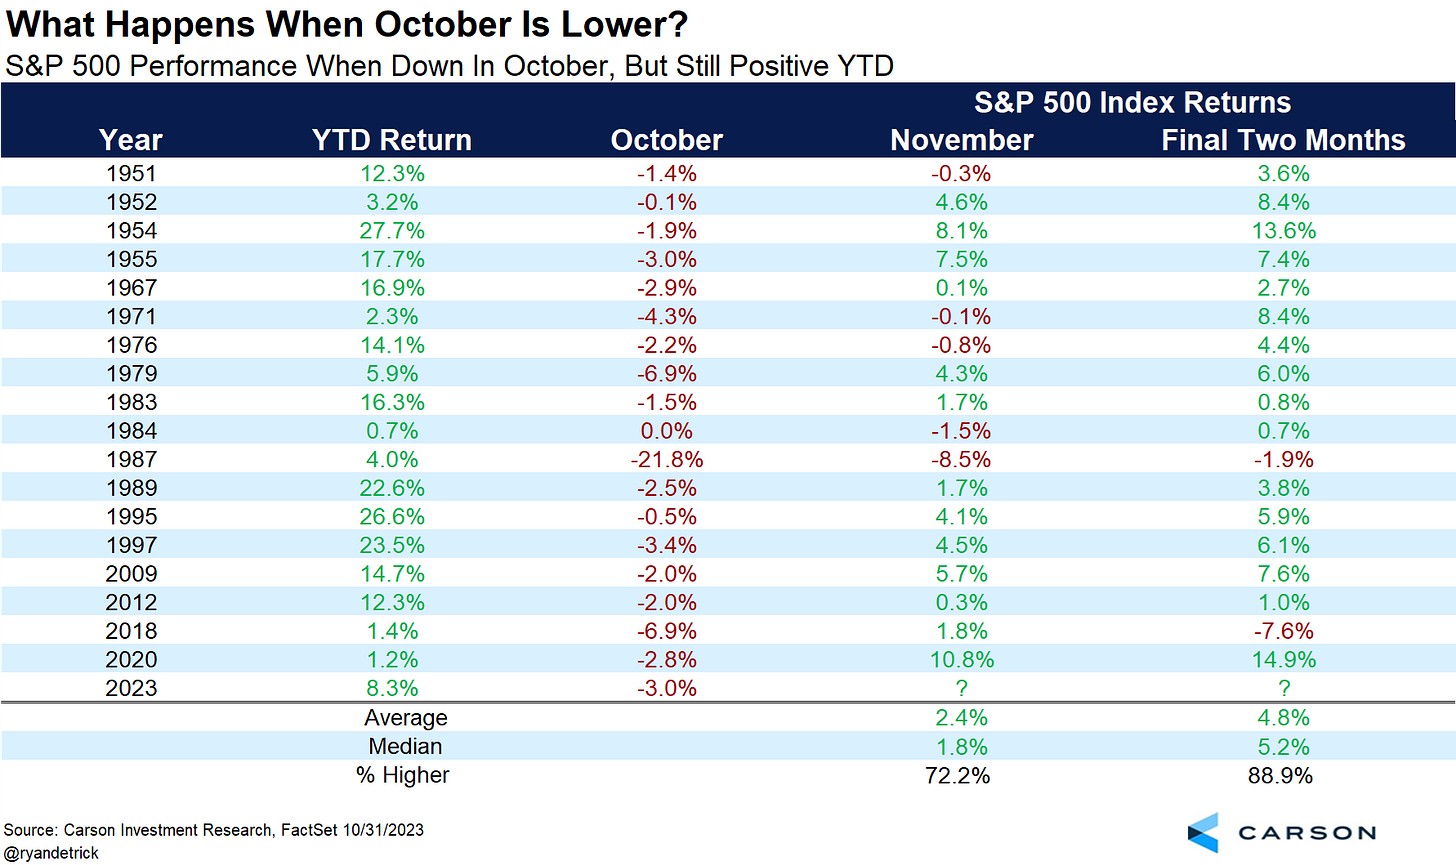
And, given the current year’s setup into year-end (stocks down in October but higher for the year), Ryan Detrick, CMT notes that November has been higher the last 7 instances:
At risk of stating the obvious, it’s important to remember that only price pays. These seasonal charts are just a roadmap for how humans have behaved historically.
We only use these tools to put the environment into context, similar to sentiment or positioning data.
Source: LPL Research, Ryan Detrick, CMT
Systematic traders hold stock positions lightly
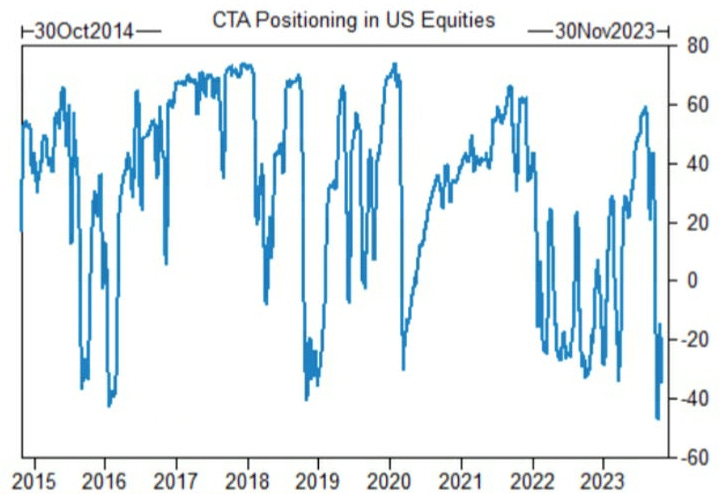
Given the selling pressure that has consumed stocks for the last three months, it should be no surprise to see that investors are holding very light positions.
Systematic funds and traders, the so-called Commodity Trading Advisors (CTAs), have significantly reduced their positions in stocks by moving from net long to net short:
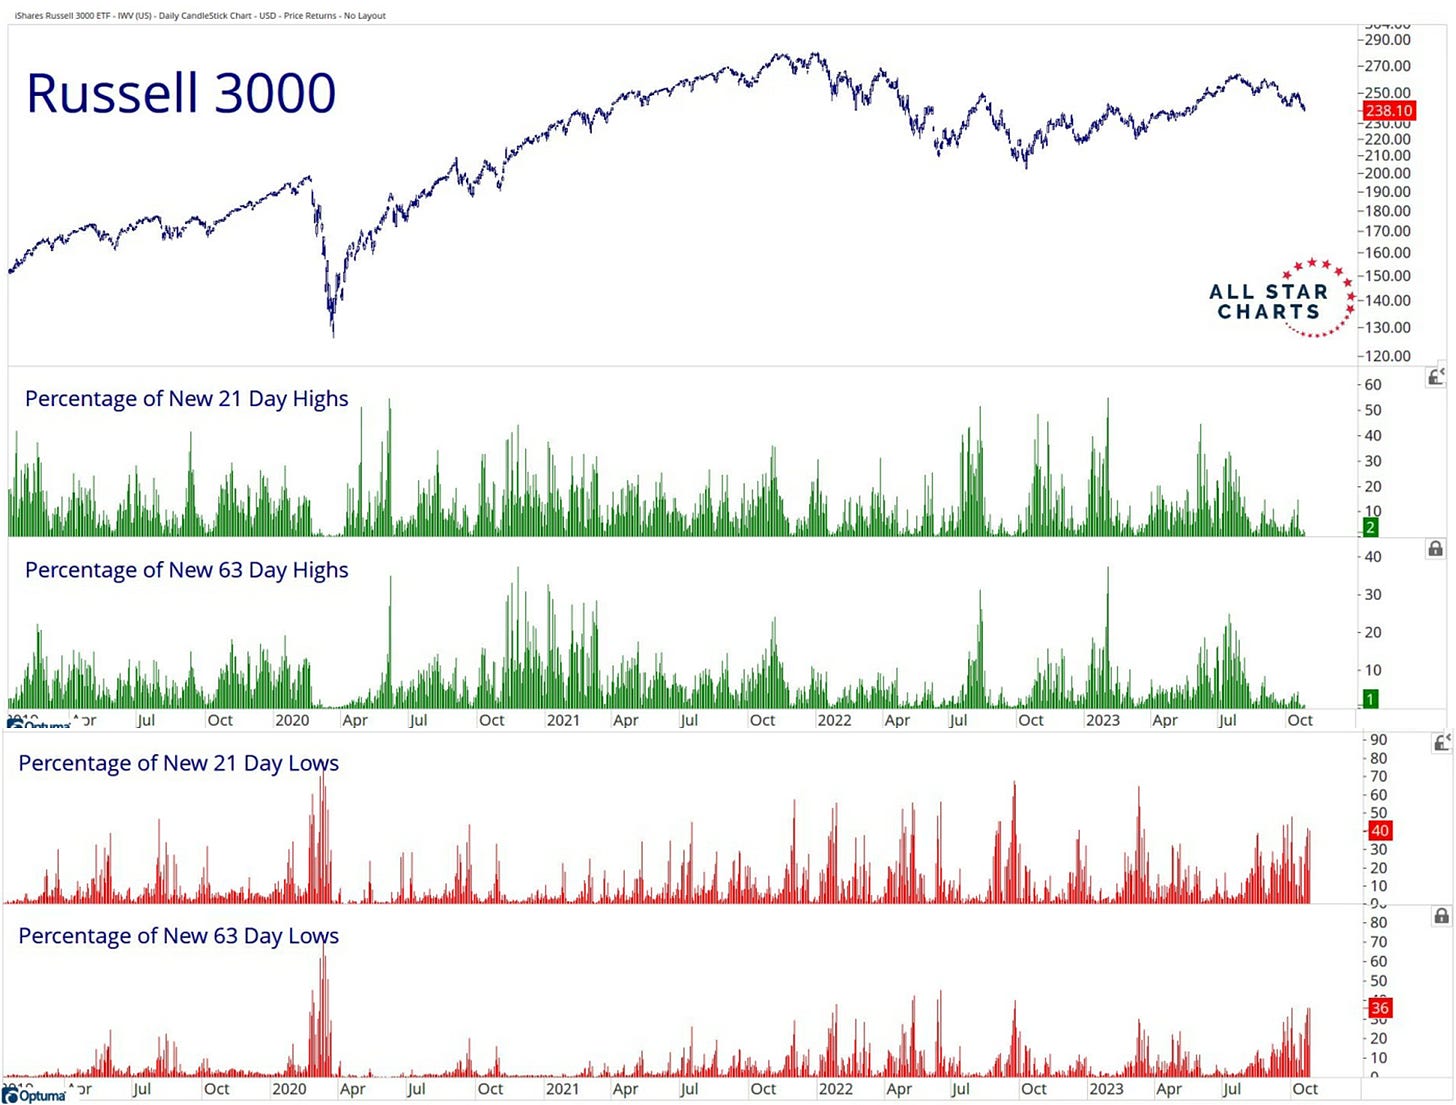
With a substantially larger percentage of U.S. stocks making new 21- and 63-day lows (40% and 36%, respectively) vs. new highs (2% and 1%) in the Russell 3000 index, these larger pools of capital are staying light and tight during this period of rising rates and indigestion among most equity groups.
Before CTA’s start adding back risk and their long positions, stocks need to stop going down.
Source: Goldman Sachs Global Investment Research, All Star Charts, Daily Chartbook
What’s with the 200-DMA?
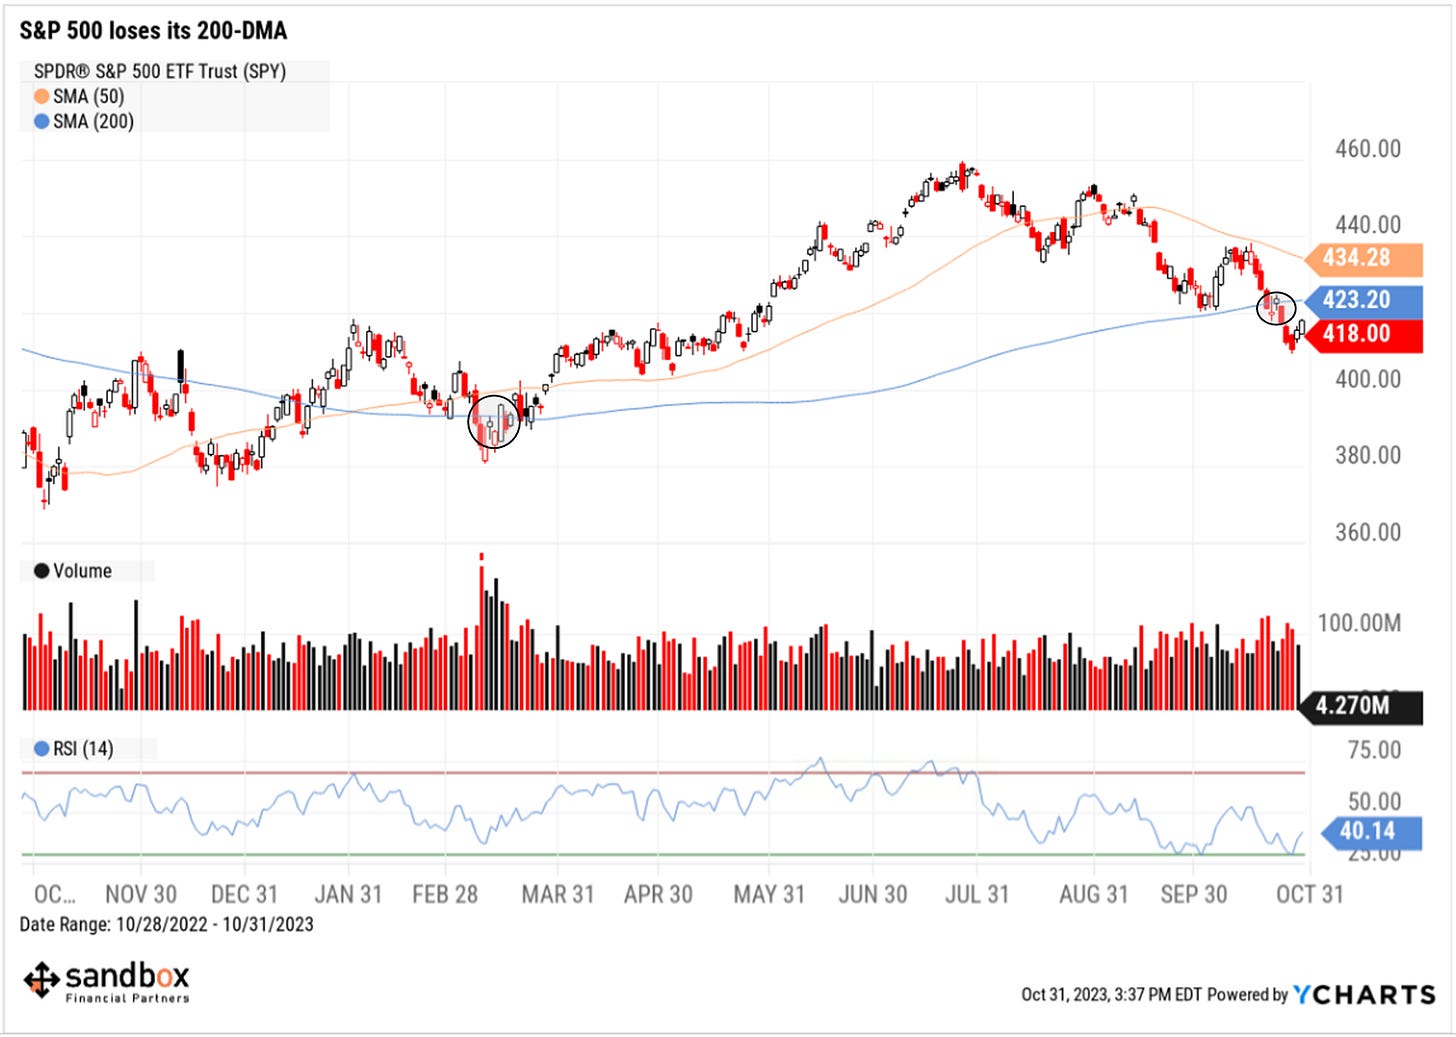
Last week, the S&P 500 index meaningfully dipped below its 200-day moving average (200-DMA) for the 1st time since the regional and community banking crisis in the spring.
So, why does that matter?
Remember, the 200-DMA – which covers roughly 40 weeks of trading – is considered a key indicator in determining overall long-term market trends. Moving averages, a smoothing mechanism to clear out the noise from day-to-day price movements, help identify the general trend: up, down, sideways, or none.
Sometimes the 200-DMA is referenced on financial networks as a key price level to watch, which has some merit – at least psychologically. But, because these moving averages are dynamic, a 2nd derivative of price itself, and does not represent actual support and resistance levels themselves where previous buyers and sellers have come into conflict, the 200-DMA is best used for trend identification.
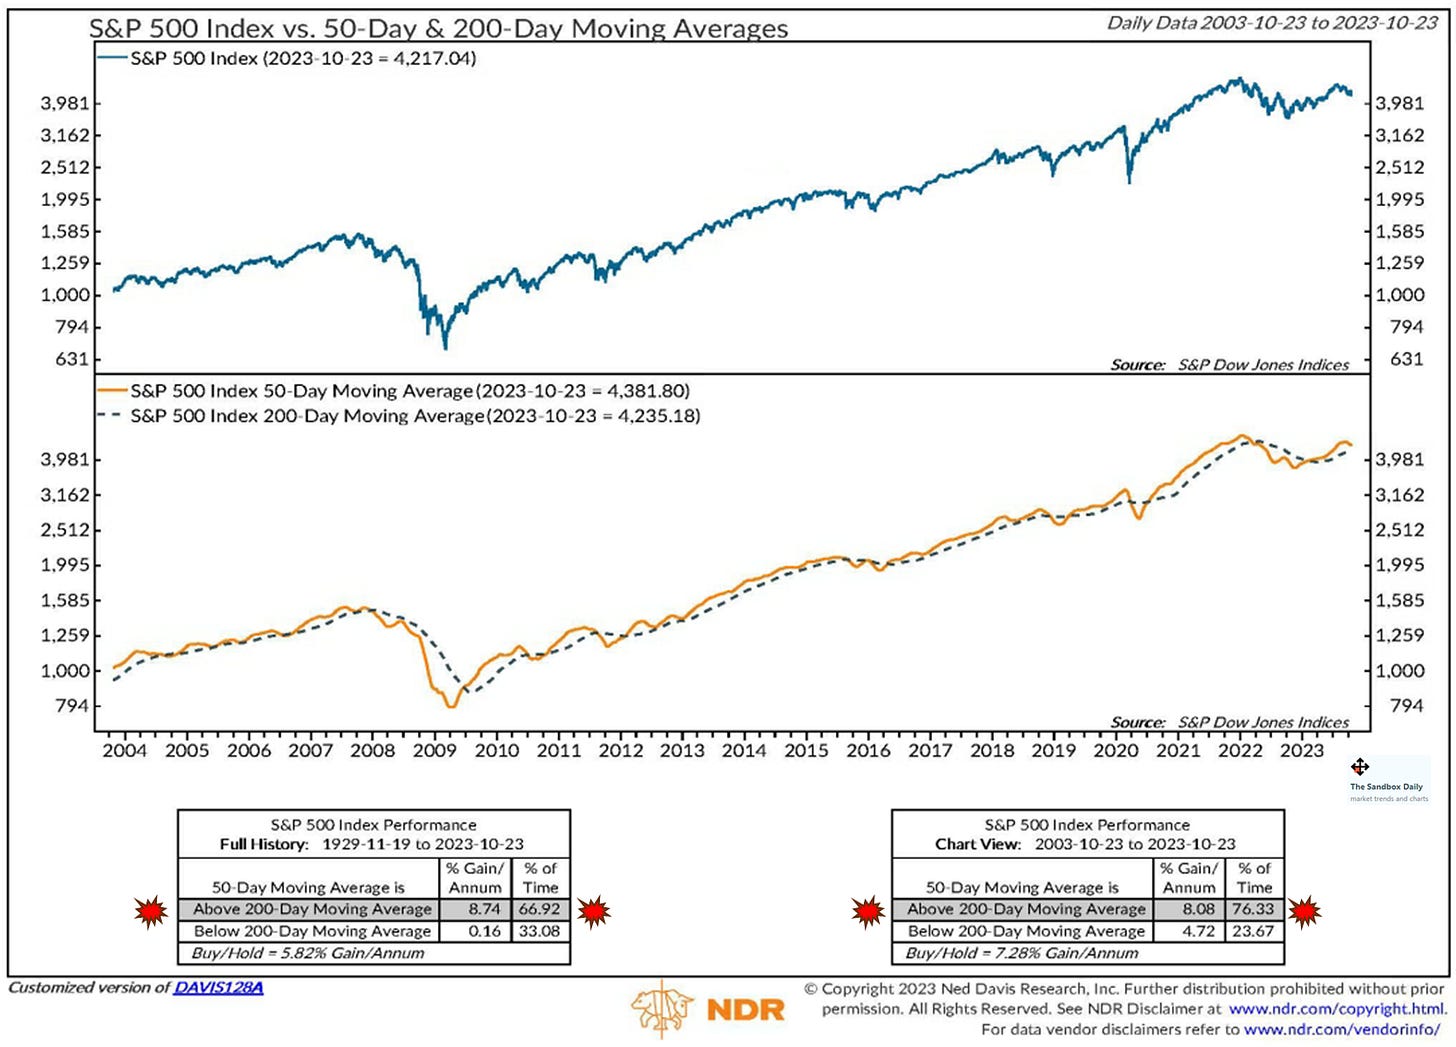
Perhaps most important for investors, S&P 500 index performance matters whether you are above that line or below. See the two data tables below.
Since 1929, the S&P 500 has found itself above the 200-DMA 67% of the time for an average annualized gain of +8.74%. The other 33% of the time is when the index spent its time below the 200-DMA, returning just +0.16%.
As Paul Tudor Jones once quipped, “Nothing good happens below the 200-day moving average.”
Source: Ned Davis Research
That’s all for today.
Blake
Welcome to The Sandbox Daily, a daily curation of relevant research at the intersection of markets, economics, and lifestyle. We are committed to delivering high-quality and timely content to help investors make sense of capital markets.
Blake Millard is the Director of Investments at Sandbox Financial Partners, a Registered Investment Advisor. All opinions expressed here are solely his opinion and do not express or reflect the opinion of Sandbox Financial Partners. This Substack channel is for informational purposes only and should not be construed as investment advice. The information and opinions provided within should not be taken as specific advice on the merits of any investment decision by the reader. Investors should conduct their own due diligence regarding the prospects of any security discussed herein based on such investors’ own review of publicly available information. Clients of Sandbox Financial Partners may maintain positions in the markets, indexes, corporations, and/or securities discussed within The Sandbox Daily. Any projections, market outlooks, or estimates stated here are forward looking statements and are inherently unreliable; they are based upon certain assumptions and should not be construed to be indicative of the actual events that will occur.


👍