Seasonality favors March, plus cross asset flows, recession indicators, volatility, and LT returns
The Sandbox Daily (2.28.2023)
Welcome, Sandbox friends.
Today’s Daily discusses the seasonality trends for investors to watch, cross asset flows from TINA to TARA, recession indicators aren’t flashing red, compression in VIX, and reviewing long-run returns.
Let’s dig in.
Markets in review
EQUITIES: Russell 2000 +0.04% | Nasdaq 100 -0.13% | S&P 500 -0.30% | Dow -0.71%
FIXED INCOME: Barclays Agg Bond -0.01% | High Yield -0.19% | 2yr UST 4.818% | 10yr UST 3.928%
COMMODITIES: Brent Crude +1.75% to $83.87/barrel. Gold +0.52% to $1,834.4/oz.
BITCOIN: -1.26% to $23,059
US DOLLAR INDEX: +0.28% to 104.966
CBOE EQUITY PUT/CALL RATIO: 0.66
VIX: -1.19% to 20.70
Quote of the day
"Efficient" markets exist only in textbooks. In truth, marketable stocks and bonds are baffling, their behavior usually understandable only in retrospect.
-Warren Buffett, Annual Shareholder Letter 2022
Seasonality could provide relief around the corner
When assessing the underlying seasonality trends, the data reflects that a messy February is perfectly normal. And with the books closed on February, that is just what we got. Rates catching up to the Fed and a strong U.S. dollar both caused equities to give back some of those juicy January gains.
Historically, as we move into spring, March and April are two of the better months for the S&P 500 index.
Since 1950 (yellow bars), the S&P 500 gained +1.1% in March, while April was up +1.5%. When you consider 2023 is a pre-election year, those returns (black bars) went to +1.9% and +3.5%, respectively. Even including the 12% drop in 2020 when the arrival of COVID-19 gripped markets, March is still positive on average over the past 10 years (green bar).
After the nearly 17% rally off the October lows into early/mid-February, a period of consolidation makes sense. The good news is March and April are historically strong seasonal periods for markets.
Source: Ryan Detrick, All Star Charts
Cross asset flows
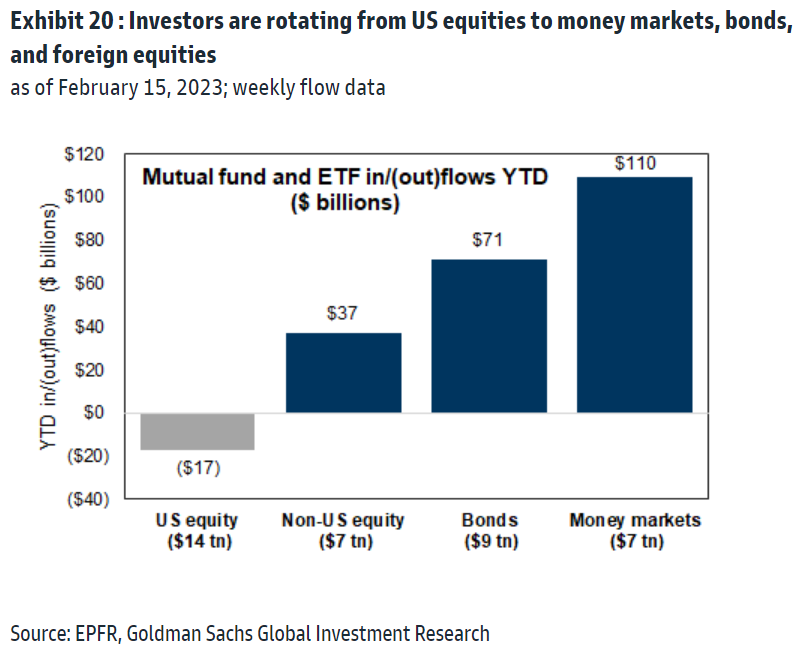
Year-to-date (YTD) cross asset flows has been marked by a shift from TINA (there is no alternative) to TARA (there are reasonable alternatives).
Defying surging yields and poor performance, flows into U.S. equities remained positive in 2022, while non-U.S. equity funds and bond funds experienced outflows. However, the flow picture has shifted year-to-date as money market funds, bond funds, and non-U.S. equity funds have garnered inflows YTD while U.S. stocks have experienced outflows.
Perhaps this shift in flow activity reflects the diminishing risk/reward for U.S. equities relative to the alternatives. Remember, many sell side analysts forecast the S&P 500 will return flat to negative the rest of the year, based on their previous 2023 outlook calls.
TARA sounds refreshing, doesn’t it?
Source: Goldman Sachs Global Investment Research
Recession indicators aren’t flashing red
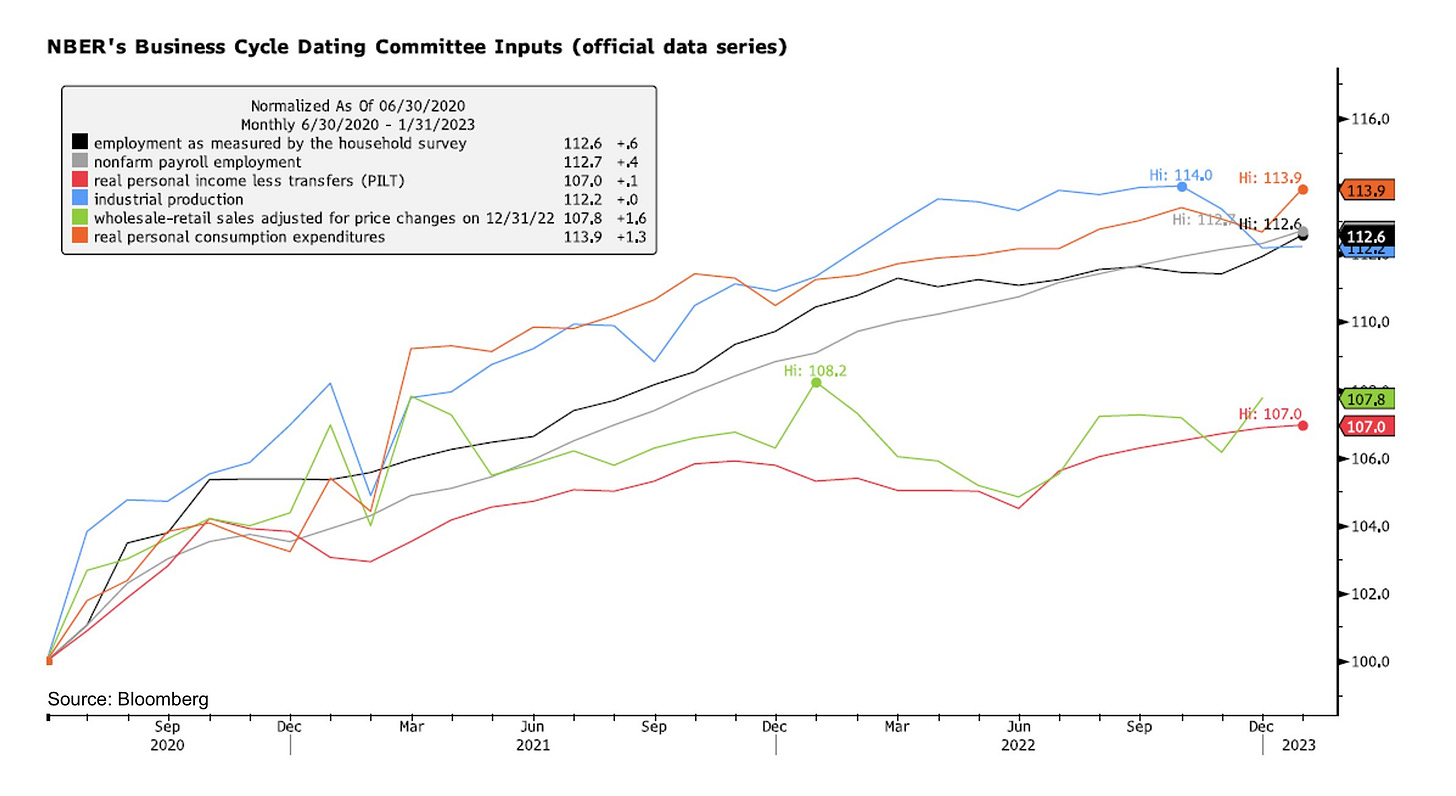
In regards to data tracked by the National Bureau of Economic Research (NBER) – the non-profit, non-partisan organization dedicated to conducting economic research as well as being tasked as the official arbiters in declaring recessions in the United States – 6 of their 6 indicators are higher on the latest reading, and 4 out of 6 are at post-Covid highs:
Much of this strength is being driven by the resilient consumer, who is still working thanks to an unemployment level at a 53-year low and who is still spending in droves. For example, here is real personal spending (i.e. removing inflation) that shows a strong snap back in January – the strongest MoM gain since March 2021.
Source: Nick Reece, Liz Ann Sonders
Lower VIX, lower equities?
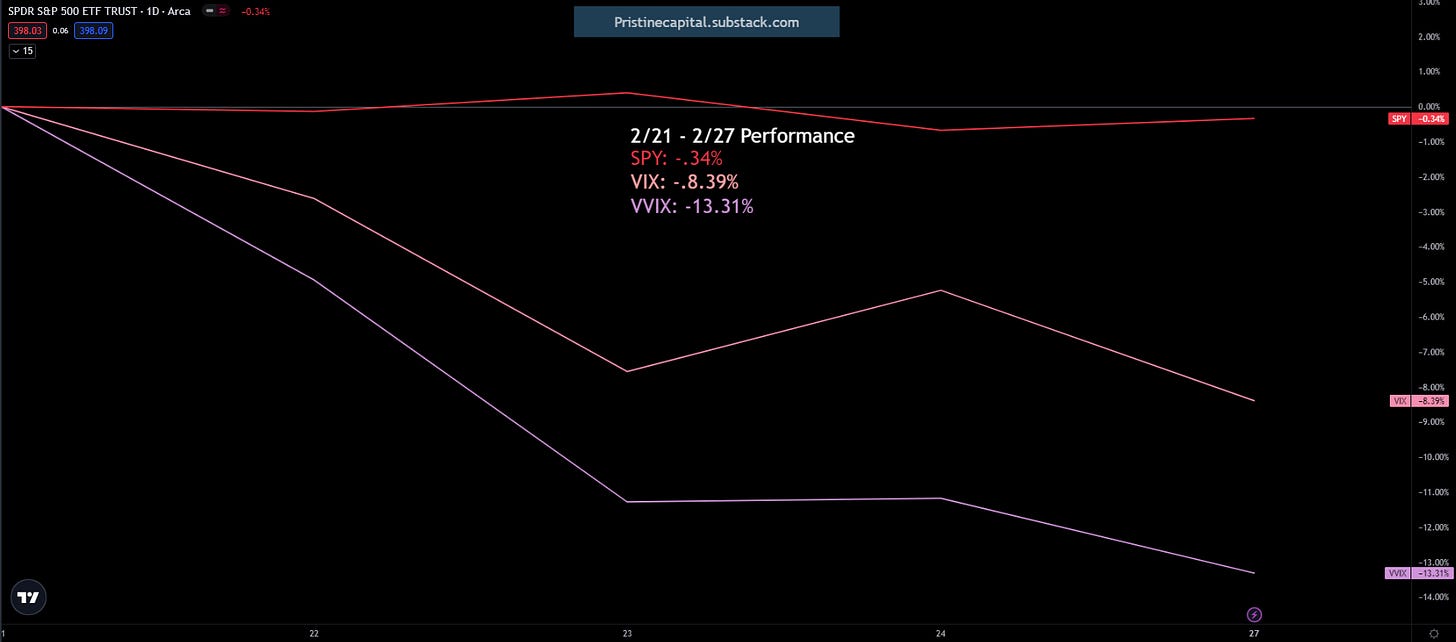
From February 21st until today, the VIX has declined meaningfully (-8.39%) but it hasn’t translated to any S&P 500 gains (-0.34%).
Volatility declines often fuel equity rallies. So, if the market cannot rally when volatility compresses materially, that’s a breakdown worth watching over the short run.
Source: Pristine Capital
Long-run returns around the world
This chart shows annualized real* equity, bond, and short-dated bill (cash equivalents) returns over the last 123 years for leading capital markets around the world with continuous investment histories plus the five composite indexes, namely the World index (WLD), the World ex-USA index (WXU), the Europe index (EUR), the developed markets index (DEV), and the emerging markets index (EMG) ranked in ascending order of equity market performance.
The real equity return was positive everywhere, typically around 3% to 6% per year. Equities were the best-performing asset class everywhere. Furthermore, bonds outperformed bills in every country except Portugal (PRT).
This overall pattern, of equities outperforming bonds and bonds beating bills, is what we would expect over the long haul since equities are riskier than bonds, while bonds are riskier than cash.
The United States ranked third in equity performance (6.4%/yr) and seventh for bonds (1.7%/yr).
*Real annualized returns are nominal returns adjusted for inflation.
Source: Credit Suisse
That’s all for today.
Blake
Welcome to The Sandbox Daily, a daily curation of relevant research at the intersection of markets, economics, and lifestyle. We are committed to delivering high-quality and timely content to help investors make sense of capital markets.
Blake Millard is the Director of Investments at Sandbox Financial Partners, a Registered Investment Advisor. All opinions expressed here are solely his opinion and do not express or reflect the opinion of Sandbox Financial Partners. This Substack channel is for informational purposes only and should not be construed as investment advice. Clients of Sandbox Financial Partners may maintain positions in the markets, indexes, corporations, and/or securities discussed within The Sandbox Daily.


