Seasonality in stocks appears favorable, the bond rout continues, and the magazine cover indicator
The Sandbox Daily (10.24.2022)
Welcome, Sandbox friends.
Today’s Daily discusses the seasonal trends that favor near-term stock performance, the continuing misery around the bond market, and print media as contrarian bullish signals.
Let’s dig in.
Markets in review
EQUITIES: Dow +1.34% | S&P 500 +1.19% | Nasdaq 100 +1.06% | Russell 2000 +0.35%
FIXED INCOME: Barclays Agg Bond -0.14% | High Yield +0.07% | 2yr UST 4.494% | 10yr UST 4.215%
COMMODITIES: Brent Crude -0.11% to $93.50/barrel. Gold +0.04% to $1,657.0/oz.
BITCOIN: -1.32% to $19,331
US DOLLAR INDEX: -0.13% to 111.848
CBOE EQUITY PUT/CALL RATIO: 0.58
VIX: +1.19% to 29.85
Seasonality in stocks appear favorable
Taking stock of some recent price action and developments:
Successful retest of the June lows (slightly undercut but held the general levels)
Capitulation and major intra-day reversal on CPI day (October 13th), with a 5%+ move off the intra-day low
Earnings better than feared, although ex-energy EPS is slightly negative
Fed is potentially nearing its terminal rate, and the super-sized rate hikes (75 bps) may be over at the November meeting
The NYSE new lows list is not expanding
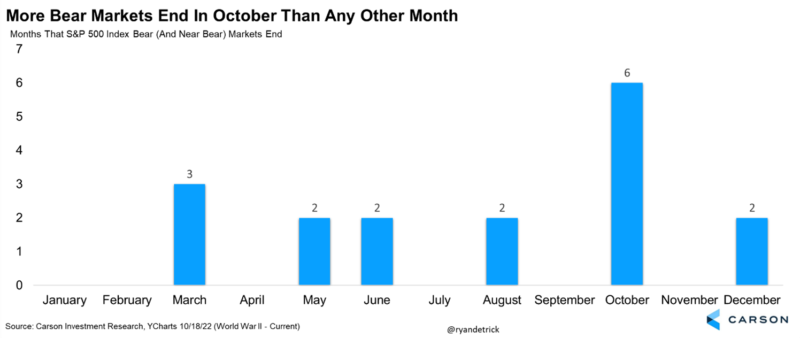
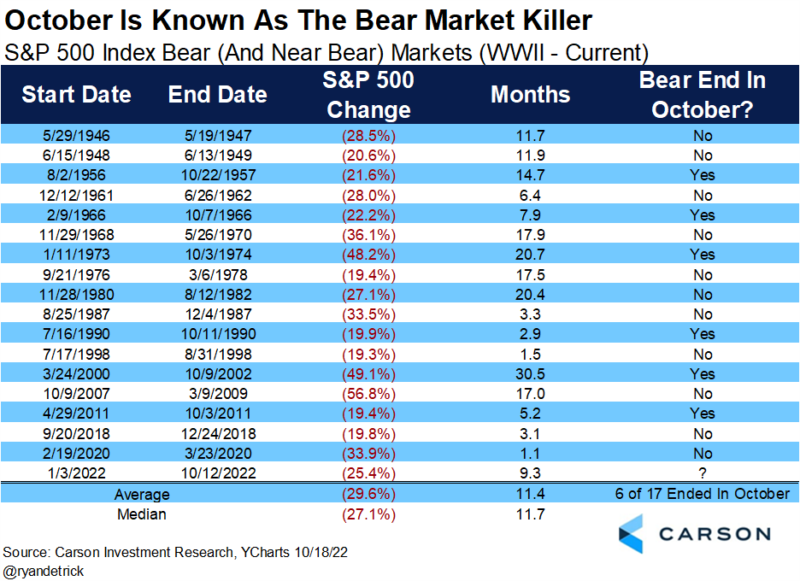
These are some of the narratives for the bulls to hang their hat on. What else? Seasonality. Going back to World War II, six of the last 17 bear markets ended in October.
When looking closer at these 17 bear markets since World War II, the average decline on the S&P 500 measured -29.6% and lasted roughly 12 months. The current bear of -25.4% and ~10 months is within the range for what history tells us is normal.
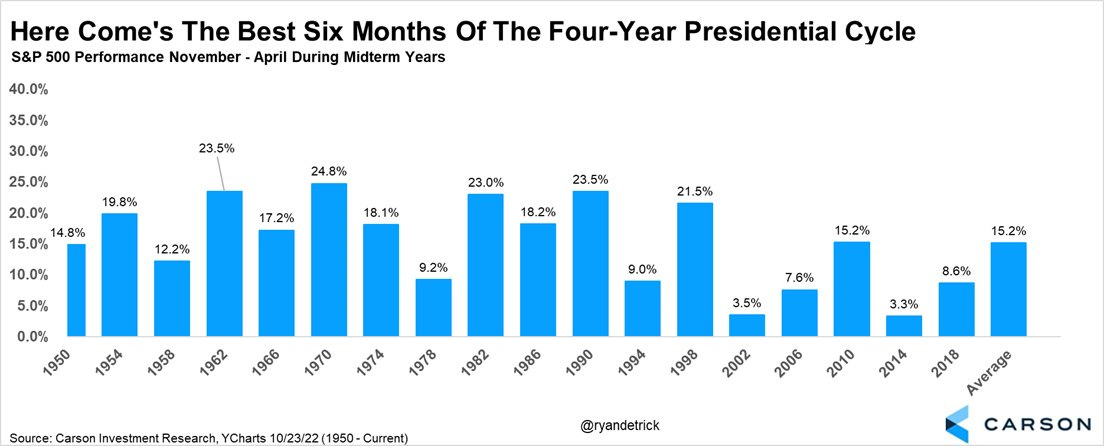
Need more seasonal winds in your sails? The best 6 months of a 4-year cycle are coming up next. The upcoming period of November-April have been higher 18 of the past 18 times during a mid-term year.
Source: Ryan Detrick
Bond misery
One of the many crash stories of 2022 can be found in the bond market, where the Bloomberg U.S. Aggregate Bond Index is down -16.74% year-to-date.
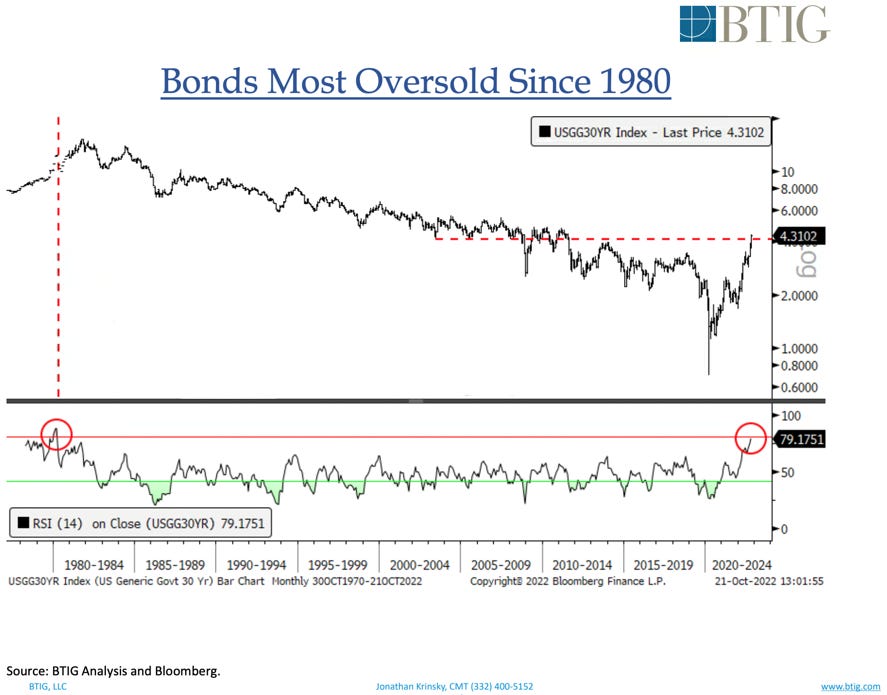
10-year yields put in a reversal on Friday of last week, but still closed higher for the 12th straight week. The monthly Relative Strength Index (RSI) for 30-year yields is the highest since 1980. This can lead to a pause, but typically the momentum peak (RSI) is not the price peak. In this case that means the final peak in yields is probably still yet to come.
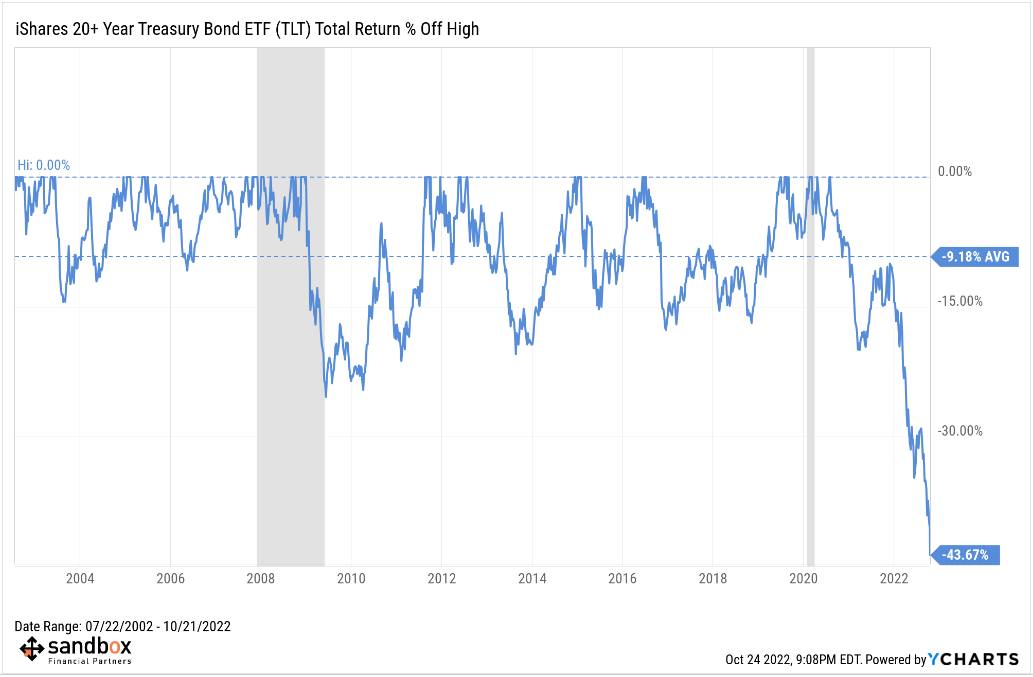
Bonds continue to sell off in dramatic fashion, with the iShares 20+ Year Treasury Bond ETF (TLT) closing at fresh lows today and now down -43.67% from its most recent high in August 2020 – a much deeper drawdown than any other in its history.
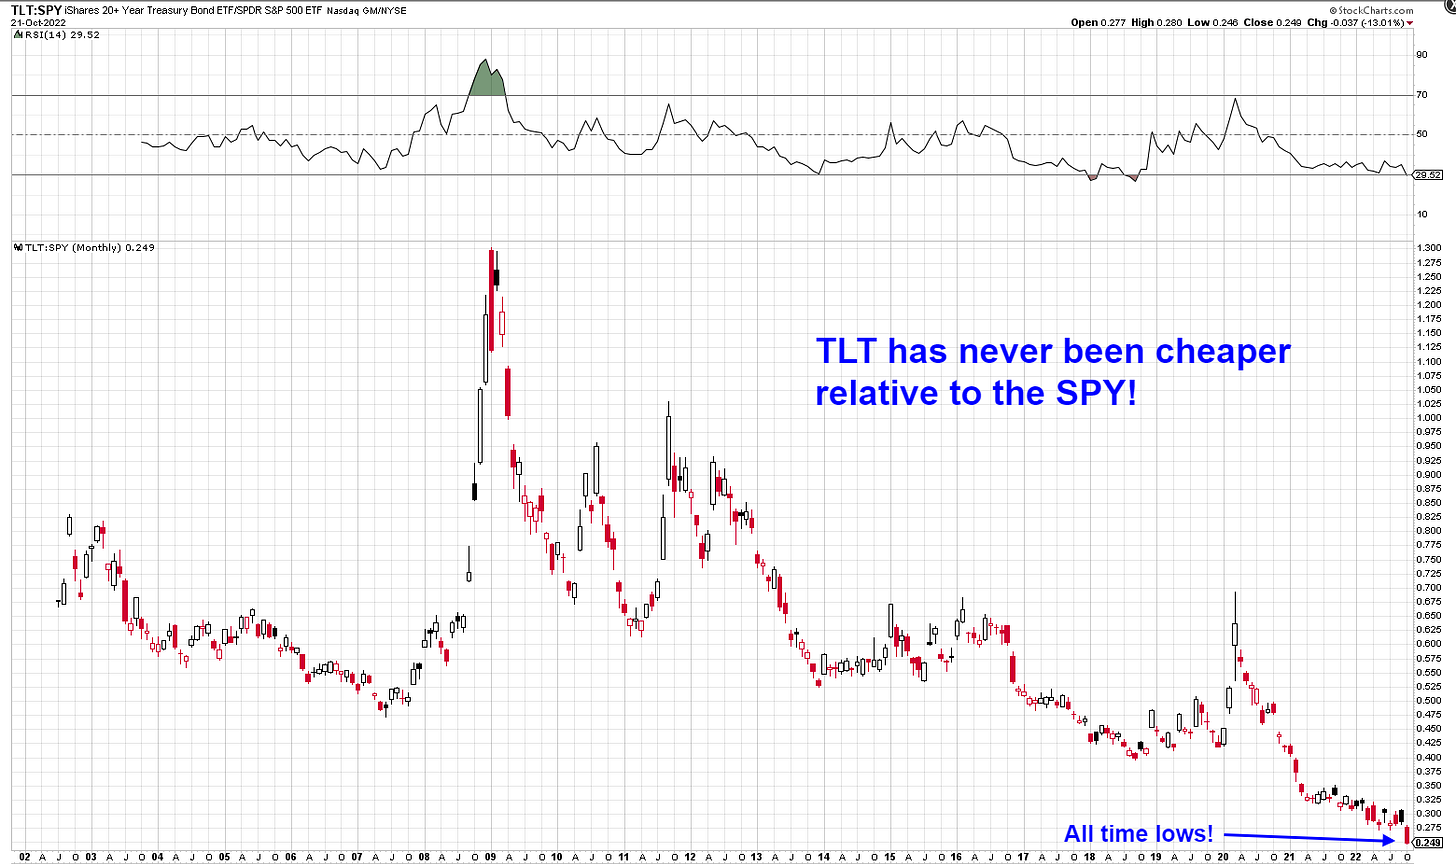
When reviewing cross-asset relationships, the iShares 20+ Year Treasury Bond ETF (TLT) has never been cheaper relative to the S&P 500 index dating back to 2002, as shown below in the ratio chart. Either $TLT goes up as yields take a breather, or $SPY continues another leg down as the index multiple compresses further. One has to give.
Source: BTIG, Heisenberg
The magazine indicator
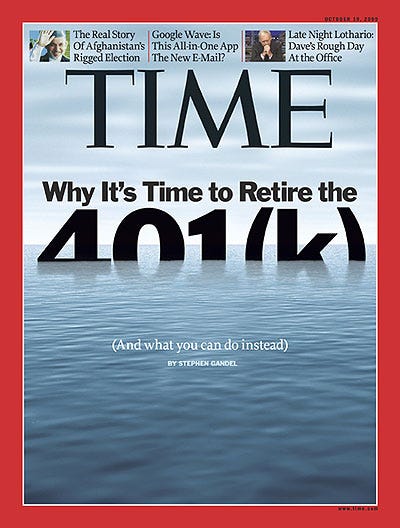
No single signal is perfect, but when you see non-financial media publishing headlines about how bad markets have become, it is a clear sign of the overall sentiment and likely contrarian bullish. Some people love buying stocks when journalists put these charts and graphics on the covers of print media.
Here is the cover of the New York Post last Monday: 401(k)nockout !
Remember this TIME cover ~7 months after the market bottomed during the Global Financial Crisis? The Dow Jones Industrial Average is up ~25,000 points since March 2009 lows.
And then this one from The New Yorker that shows a chart literally falling out the bottom of planet earth! The Nasdaq Composite Index bottomed two days after this edition was published and went on one of the most historic runs of all time.
Source: New York Post, TIME, The New Yorker
That’s all for today.
Blake
Welcome to The Sandbox Daily, a daily curation of relevant research at the intersection of markets, economics, and lifestyle. We are committed to delivering high-quality and timely content to help investors make sense of capital markets.
Blake Millard is the Director of Investments at Sandbox Financial Partners, a Registered Investment Advisor. All opinions expressed here are solely his opinion and do not express or reflect the opinion of Sandbox Financial Partners. This Substack channel is for informational purposes only and should not be construed as investment advice. Clients of Sandbox Financial Partners may maintain positions in the markets, indexes, corporations, and/or securities discussed within The Sandbox Daily.


