Seller exhaustion, plus options markets and 10 investing lessons from Morgan Stanley
The Sandbox Daily (1.18.2023)
Welcome, Sandbox friends.
Today’s Daily discusses the seller exhaustion in the market, changes in market structure exacerbating volatility (h/t options), and 10 investing lessons from Morgan Stanley.
Let’s dig in.
Markets in review
EQUITIES: Nasdaq 100 -1.27% | S&P 500 -1.56% | Russell 2000 -1.59% | Dow -1.81%
FIXED INCOME: Barclays Agg Bond +0.99% | High Yield +0.12% | 2yr UST 4.082% | 10yr UST 3.375%
COMMODITIES: Brent Crude -1.35% to $84.76/barrel. Gold -0.24% to $1,905.4/oz.
BITCOIN: -2.37% to $20,706
US DOLLAR INDEX: +0.02% to 102.403
CBOE EQUITY PUT/CALL RATIO: 0.59
VIX: +5.06% to 20.34
Are sellers becoming exhausted?
As markets have strengthened over the last few weeks and months, many investors are beginning to ask (with a whisper): have we seen exhaustion from the sellers? Did markets bottom?
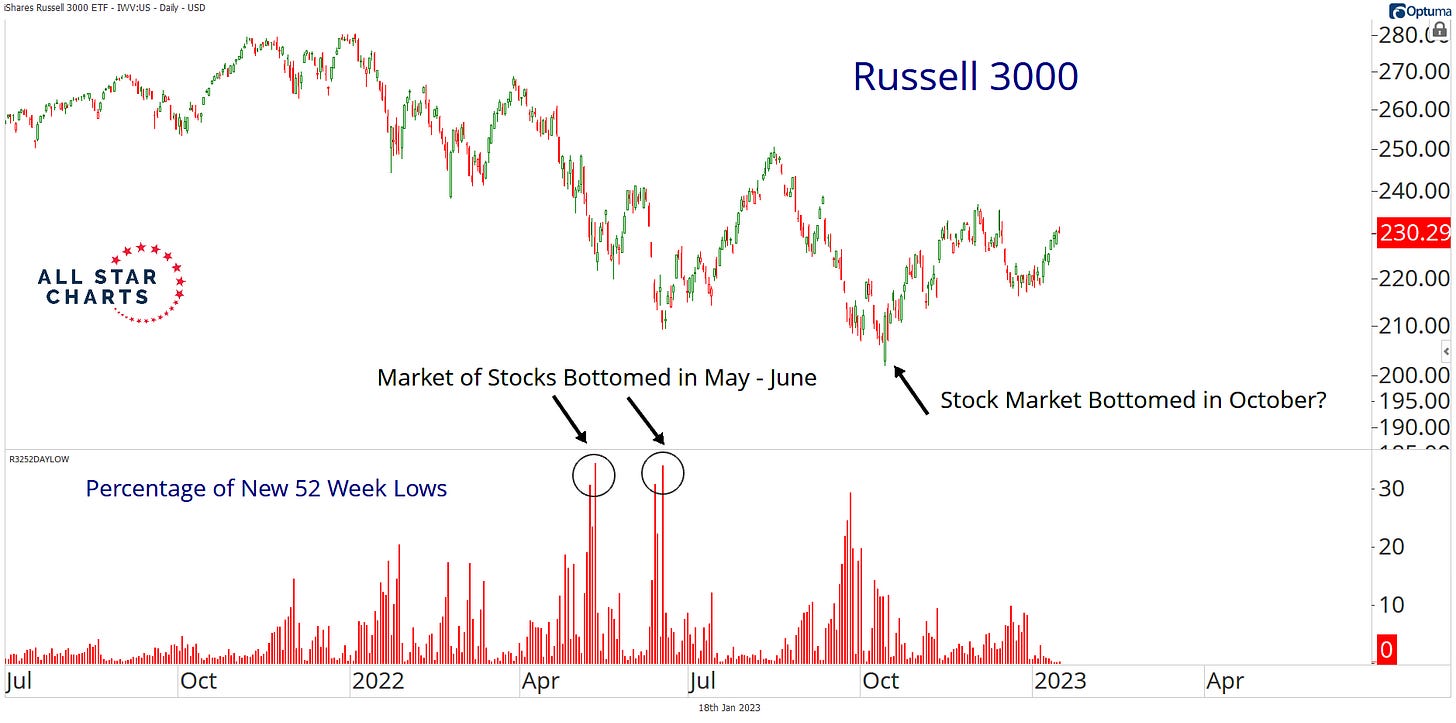
Even as major stock indices (and many individual stocks) made new lows in the 2nd half of 2022, breadth gauges were less extreme. The expansion in the new lows lists kept gathering steam through each leg lower in equity markets in 1H22, but as you can see from the June 2022 peak, the percentage of stocks making new 52 week lows peaked at the June market bottom, not the October market bottom.
As All Star Charts points out, the “market of stocks” bottomed in June, while the “stock market” bottomed in October. This is partially due to the fact the market generals, those who generally escaped the worst of the carnage, finally started to rollover. Think Apple, Microsoft, Google, Amazon, etc.
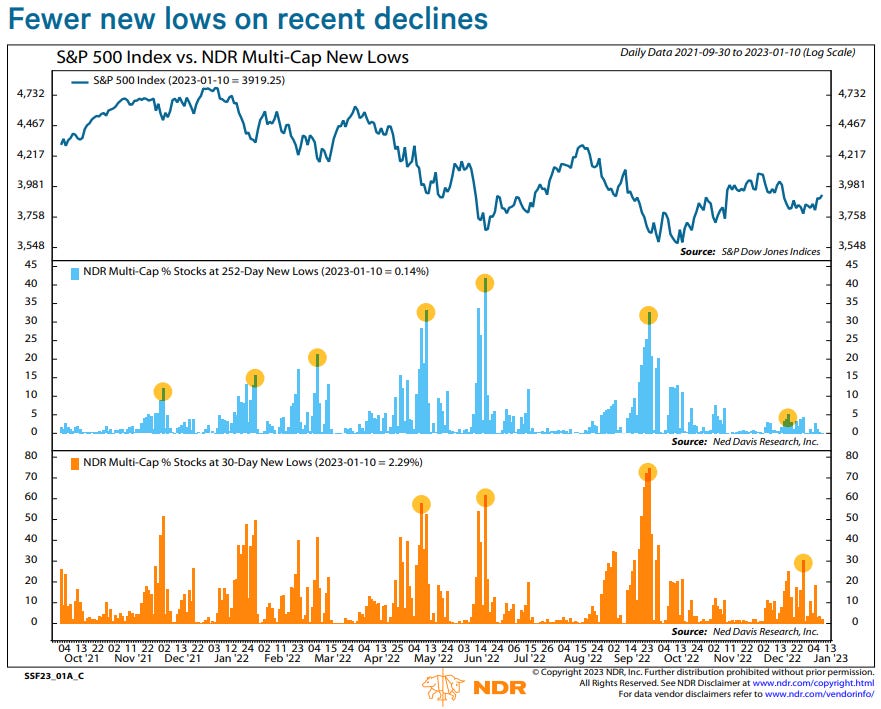
A separate, but similar report from Ned Davis Research, mostly confirms – although the research firm is including a broader basket of stocks for the same analysis. Notice the yellow bubbles hit higher percentages (more stocks hitting lows) moving through time, peak in June, and then start showing lower levels in the fall and winter.
Fewer new lows matter because, intuitively, the end of cyclical bear markets often include positive divergences – or fewer stocks making new lows even as the major indices do. These inflections are the turning points where individual stocks stop going down; less stocks going down means the market is troughing. As such, the peak in 30-day and 252-day new lows tend to peak before bear market troughs – in fact, 1-2 months on average (since 1980).
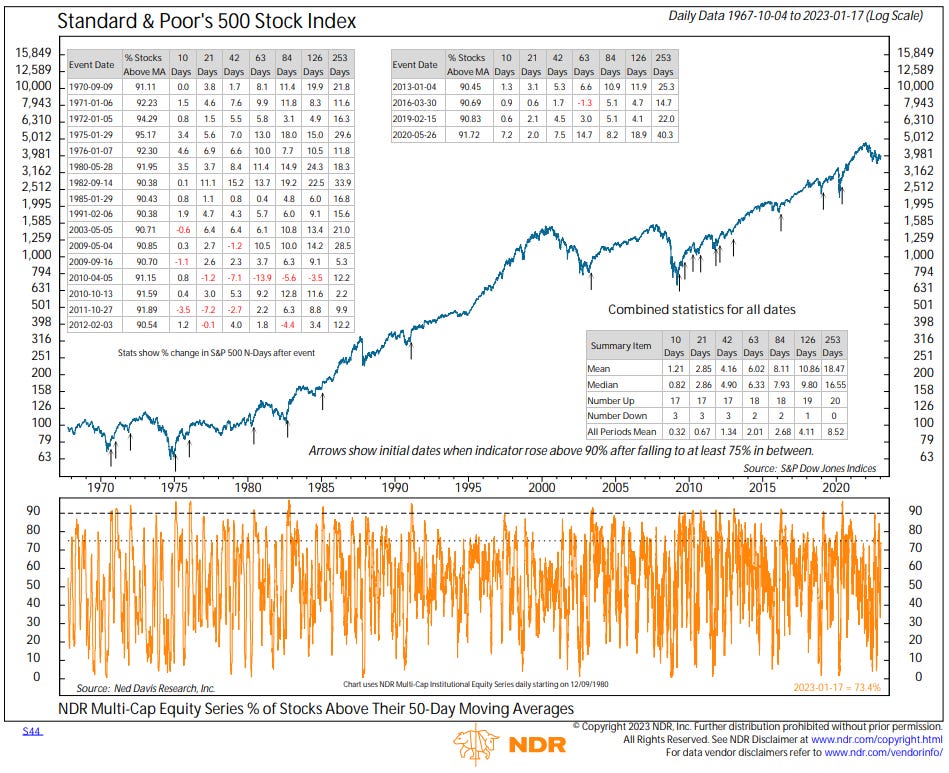
Furthermore, we also like to see short-term breadth thrusts confirm the initial moves off the bottom. First we look at 10-day and 20-day moving averages to capture the quick and initial burst in stock advancements climbing above these trendlines, demonstrating a trend change from the bears to the bulls. A more significant indicator is the percentage of stocks above their 50-day moving averages. Unlike the shorter-term gauges (10- and 20-day), this indicator is less prone to “fakeouts.” The 50-day indicator did not fire in 2022; a reading above 90% would give the first signal since May 2020.
Bottom line: while technical developments are consistent with a bear market in its later stages, there is not enough evidence to firmly declare that a new bull market is underway. Either way, we won’t know for sure for many months down the road.
Source: Ned Davis Research
Market structure changes are impacting volatility
Despite its growing popularity among retail investors and influence on markets, “0DTE” is probably a term most investors are unaware of.
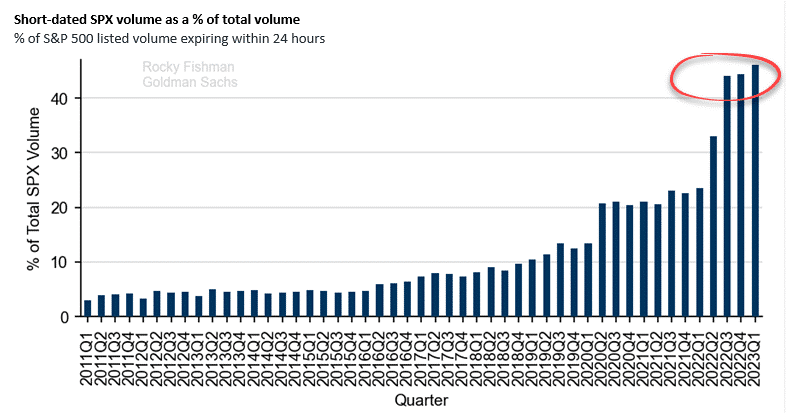
“0DTE” stands for zero days until options expiration. These are put-and-call options on individual stocks and indexes that expire within 24 hours. As the graph from Goldman Sachs shows, almost half of the options volume on the S&P 500 is “0DTE.” Such dwarfs the single-digit rates existing before the pandemic.
Given the extremely limited amount of time until expiration on these options, most of the activity in “0DTE” options is likely due to speculators. In many cases, volume on “0DTE” options spikes before important economic data releases.
Wall Street banks who are on the other side of “0DTE” trades must hedge them. To do so, they buy or short the underlying index as it moves in favor of the options owner. The growing concern is that as “0DTE” option interest grows, dealers must actively hedge larger amounts. If the options trades are correct, bullish or bearish, banks would have to buy or sell aggressively. Such could exaggerate an already significant market move.
It's not unrealistic to consider the daily market moves exceeding 2% and 3%, seemingly commonplace in 2022, was exacerbated due to options speculating and hedging activity.
Source: Goldman Sachs Global Investment Research, Lance Roberts
Quality investing
Here are 10 lessons from Morgan Stanley Managing Director and Head of International Equities, William Lock, which offer guiding principles to set the foundation for a robust investment management process.
Source: Compounding Quality
That’s all for today.
Blake
Welcome to The Sandbox Daily, a daily curation of relevant research at the intersection of markets, economics, and lifestyle. We are committed to delivering high-quality and timely content to help investors make sense of capital markets.
Blake Millard is the Director of Investments at Sandbox Financial Partners, a Registered Investment Advisor. All opinions expressed here are solely his opinion and do not express or reflect the opinion of Sandbox Financial Partners. This Substack channel is for informational purposes only and should not be construed as investment advice. Clients of Sandbox Financial Partners may maintain positions in the markets, indexes, corporations, and/or securities discussed within The Sandbox Daily.


