

Short interest on U.S. stocks is scant. Is that good or bad?
The Sandbox Daily (1.23.2025)

Welcome, Sandbox friends.
Today’s Daily discusses:
short bets against U.S. stocks at low end of historical range
Let’s dig in.
Blake
Markets in review
EQUITIES: Dow +0.92% | S&P 500 +0.53% | Russell 2000 +0.47% | Nasdaq 100 +0.22%
FIXED INCOME: Barclays Agg Bond -0.16% | High Yield +0.13% | 2yr UST 4.295% | 10yr UST 4.646%
COMMODITIES: Brent Crude -1.39% to $77.90/barrel. Gold -0.34% to $2,761.4/oz.
BITCOIN: -0.71% to $103,584
US DOLLAR INDEX: -0.03% to 108.135
CBOE TOTAL PUT/CALL RATIO: 0.76
VIX: -0.53% to 15.02
Quote of the day
“Only put off until tomorrow what you are willing to die having left undone.”
- Pablo Picasso
Before we begin, what is “short interest” ?!?
Short interest is a key data point for investors that provides insight into market sentiment and how traders are positioning themselves.
Short interest refers to the total number of shares of an index or stock that have been sold short by investors but not yet covered or closed out. When an investor "shorts" a stock, they are betting that its price will fall. To do this, they borrow shares and sell them at the current price, hoping to buy them back later at a lower price to return to the lender, pocketing the difference as profit. Alternatively, if the price of the underlying stock rises, the short seller loses money.
An asset with rising/high short interest reflects some combination of a bearish outlook, waning investor sentiment, and deteriorating fundamentals, while falling/low short interest is essentially the opposite.
An investor may engage in short selling for many reasons, chief among them to 1) profit from an expected decline in the price of a stock or to 2) hedge the risk of other positions. In other words, speculating (risk on behavior) or hedging (risk off behavior). There’s also the short squeeze motivation but that’s for another discussion.
Short bets against U.S. stocks at low end of historical range
Moving along…
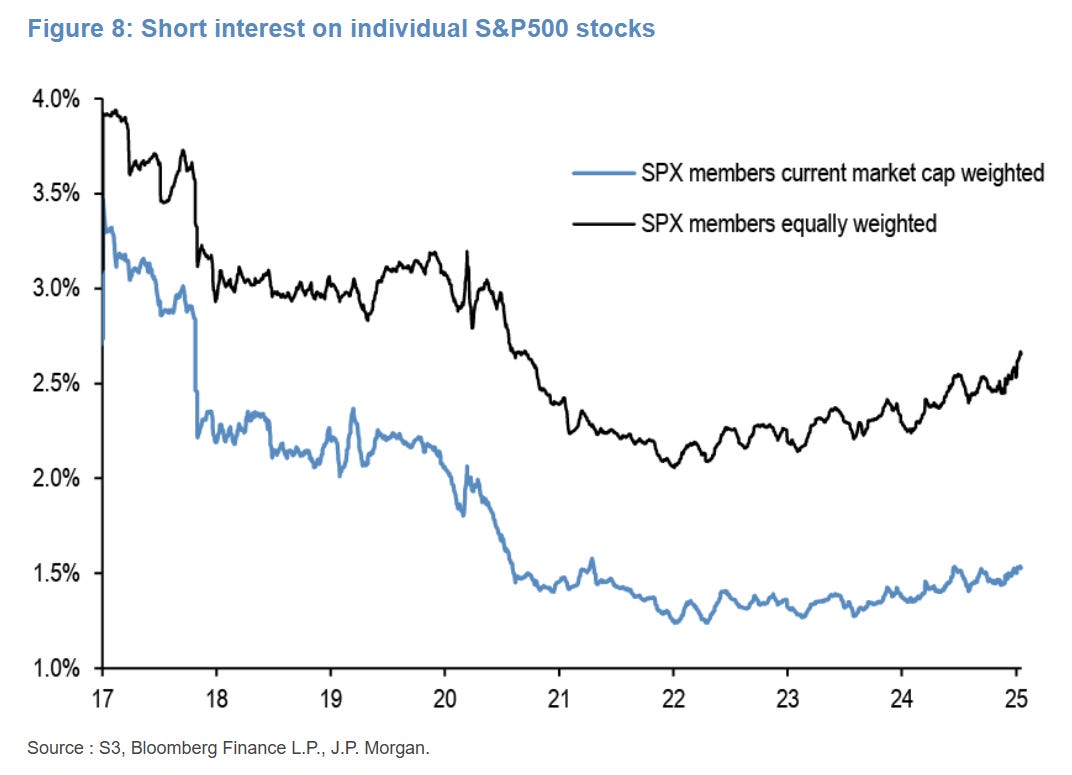
Viewing the chart below, we can see the overall level of short interest on both the S&P 500 and Nasdaq 100 indices has been steadily falling in recent years.
At present, the absolute level is lower by a fairly large amount when compared to pre-pandemic levels, currently sitting at the low end of its historical range.

Drilling down to the individual stock level yields roughly the same results.
This data suggests any number of the following takeaways for an investor:
declining short interest to successive record lows has provided a steady flow of support to U.S. equities over the past two+ years helping suppress volatility (implicit short vol trade)
there remains scant evidence of hedging demand (via equity themselves) despite two years of strong domestic equity performance
positioning is stretched because investors feel optimistic in the economy, an offset to other sentiment data that supports a more bearish tone
low current levels pose a vulnerability to stocks in a scenario where negative news starts reversing the trend (i.e. reduced fire power on the edges)
In other words, something for everyone – frustrating as heck but no different than any other data point or report.
Source: J.P. Morgan Markets
That’s all for today.
Blake
Questions about your financial goals or future?
Connect with a Sandbox financial advisor – our team is here to support you every step of the way!
Welcome to The Sandbox Daily, a daily curation of relevant research at the intersection of markets, economics, and lifestyle. We are committed to delivering high-quality and timely content to help investors make sense of capital markets.
Blake Millard is the Director of Investments at Sandbox Financial Partners, a Registered Investment Advisor. All opinions expressed here are solely his opinion and do not express or reflect the opinion of Sandbox Financial Partners. This Substack channel is for informational purposes only and should not be construed as investment advice. The information and opinions provided within should not be taken as specific advice on the merits of any investment decision by the reader. Investors should conduct their own due diligence regarding the prospects of any security discussed herein based on such investors’ own review of publicly available information. Clients of Sandbox Financial Partners may maintain positions in the markets, indexes, corporations, and/or securities discussed within The Sandbox Daily. Any projections, market outlooks, or estimates stated here are forward looking statements and are inherently unreliable; they are based upon certain assumptions and should not be construed to be indicative of the actual events that will occur.
Please see additional disclosures at the Sandbox Financial Partners website: