Stock market corrections in context, plus "sell in May and go away," public vs. private markets, and wage inflation
The Sandbox Daily (4.30.2024)
Welcome, Sandbox friends.
Today’s Daily discusses:
corrections happen (all the time, actually)
sell in May??!?
public vs. private markets
employment cost pressures accelerate
Let’s dig in.
Markets in review
EQUITIES: Dow -1.49% | S&P 500 -1.57% | Nasdaq 100 -1.92% | Russell 2000 -2.09%
FIXED INCOME: Barclays Agg Bond -0.41% | High Yield -0.73% | 2yr UST 5.039% | 10yr UST 4.688%
COMMODITIES: Brent Crude -0.61% to $87.87/barrel. Gold -2.27% to $2,304.1/oz.
BITCOIN: -5.41% to $60,542
US DOLLAR INDEX: +0.63% to 106.245
CBOE EQUITY PUT/CALL RATIO: 0.61
VIX: +6.68% to 15.65
Quote of the day
“Every adversity, every failure, every heartache carries with it the seed of an equal or greater benefit.”
- Napoleon Hill, Author
Corrections happen (all the time, actually)
And just like that, the S&P 500 index has gone risk-off, experiencing its first 5% pullback of the year.
Between the geopolitical headlines and sticky inflation data causing a pivot hangover, there seems to be plenty to worry about suddenly. It makes it easy to forget that the S&P 500 had just rallied 28% in six months from October to March.
Investors must remind themselves that 5% corrections are perfectly normal, occurring roughly 3-4 times per year on average over the last 100 years.
In fact, 5% corrections happen so often that since 1900 the market has been in a state of 5% drawdowns more than half the time, while still compounding 8-9% returns per year.
Source: Jurrien Timmer
Sell in May??!?
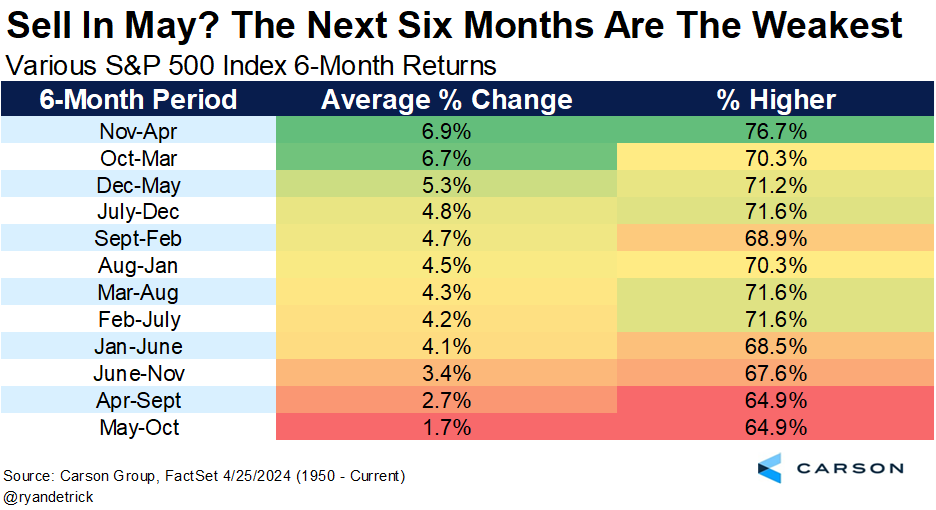
After a choppy April, we now turn the calendar forward to May and arrive at the old market maxim “sell in May and go away”.
"Sell in May and go away" is a well-known saying in finance. It is based on stocks' historical underperformance during the 6-month period from May to October. The historical pattern was popularized by the Stock Trader's Almanac, which found investing in stocks as represented by the Dow Jones Industrial Average from November to April and switching into fixed income the other 6 months would have "produced reliable returns with reduced risk since 1950."
The next 6 months (May to October) are indeed the worst possible 6-month combination of the calendar year, however the S&P 500 still generates an average gain of +1.7% since 1950 while moving higher ~65% of the time. Not exactly terrible.
Reviewing this seasonal period over just the last 10 years, it appears that markets have bucked this 6-month trend – higher 8 times and producing an average return of +4.0%.
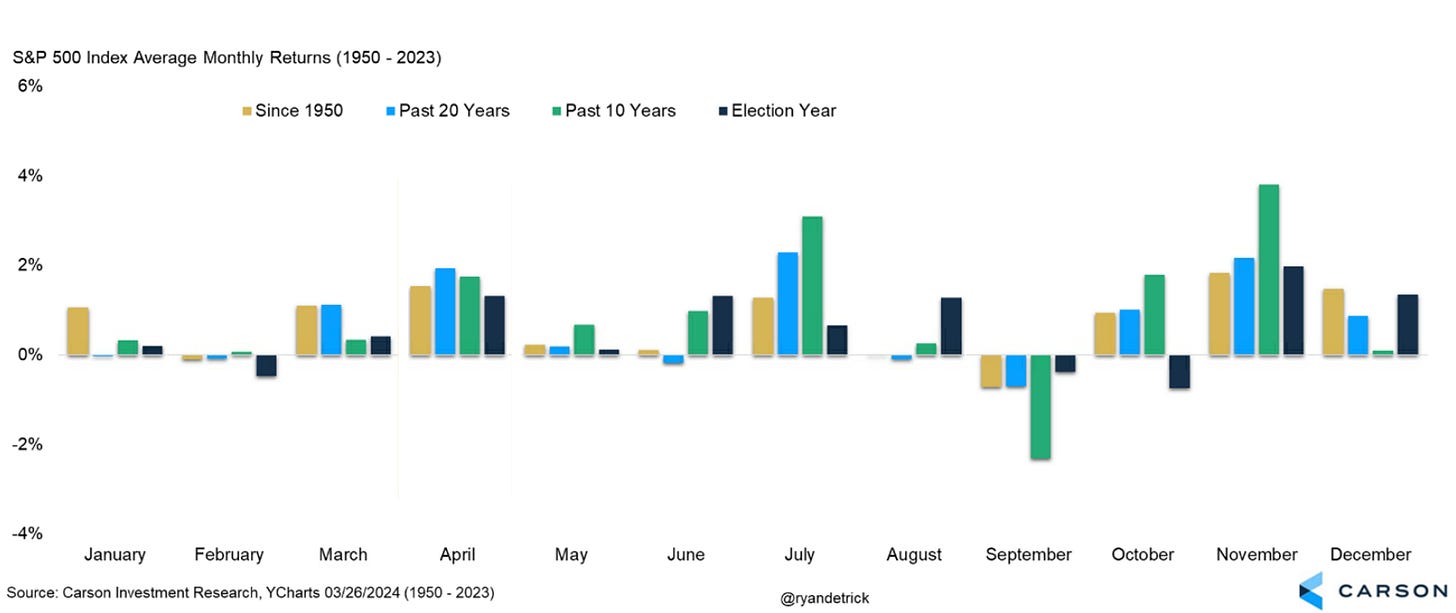
Digging into May returns themselves, the market is only fractionally positive since 1950 (yellow bar) and up +0.7% in the past 10 years (green bar) – positive 9 of the last 10 times. Given 2024 is an election year, it would appear a small and muted positive return is consistent with other time frames for April as well.
Source: Ryan Detrick (Part 1), Ryan Detrick (Part 2)
Public vs. private markets
Perspective is everything, in both absolute and relative terms.
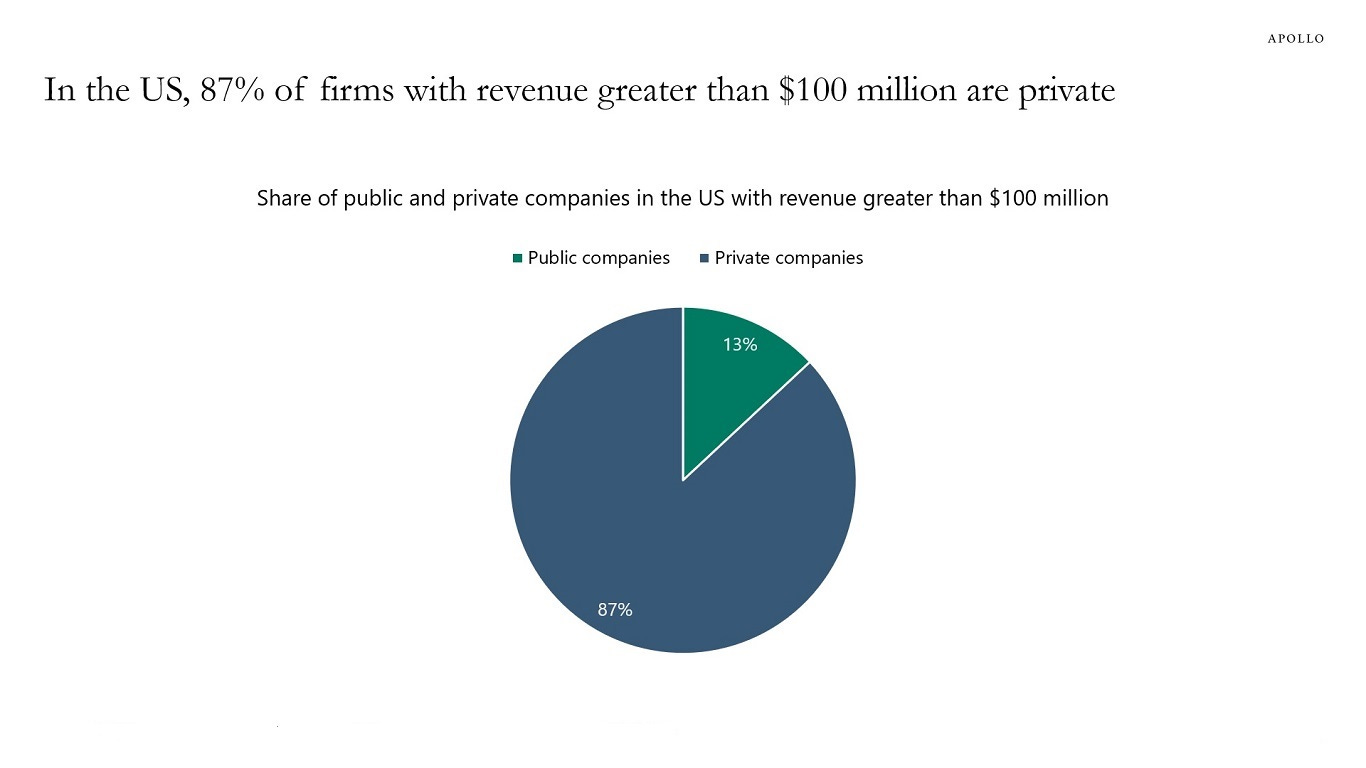
While so much of our time and attention is focused on public markets – and rightfully so since the average investor’s portfolio is principally comprised of publicly traded instruments – its private markets that dwarf their public market counterparts, both in share of employment and revenues.
Total global employment in S&P 500 companies is 29 million, while total employment in the U.S. economy is 158 million. That means 80% of total employment in the U.S. economy resides outside the companies of the S&P 500.
What’s more, 87% of all companies in the United States with revenues exceeding $100 million are private.
These employment and revenue figures confirm the vast majority of the U.S. economy resides in the private markets.
Source: Torsten Slok
Employment cost pressures accelerate
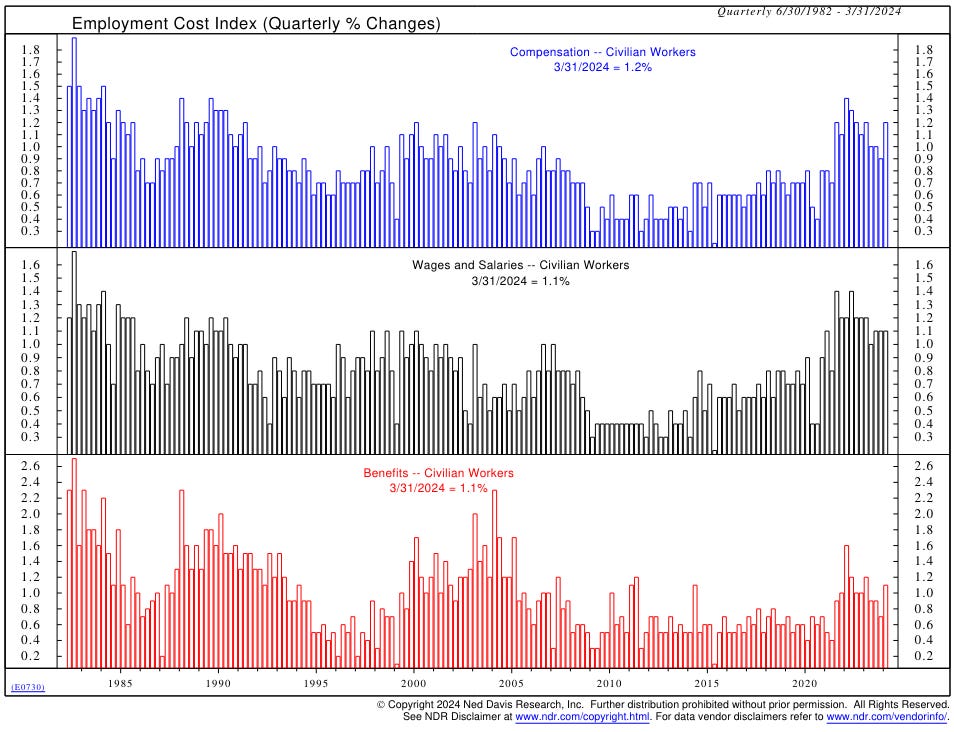
Another day, another hotter-than-expected inflation report – inflation continues to surprise to the upside in 2024. Compensation inflation pressures that built up in recent years are still working through the economy in a way that economic policymakers might not have anticipated.
The Employment Cost Index (ECI) – perhaps the best barometer of how much employers spend on compensation (i.e. wage inflation) – jumped +1.2% in Q1, the most in a year, and above the consensus of +1.0%. The increase is roughly double the +0.6%-0.8% range in the three years prior to the pandemic.
Elevated employment costs in this cycle, along with this acceleration in Q1, reflect labor markets that remain tight, pushing off expectations for Fed rate cuts this year.
Both private sector and state & local government compensation picked up last quarter. The increase by industry was led by health care, professional and business services, and wholesale trade, where labor shortages have been more pronounced.
On a year-over-year basis, the ECI increased +4.2%, the same as in the previous quarter, and well above the +2.8% YoY pre-pandemic pace. While benefits growth eased slightly from the prior quarter, wage and salary compensation picked up +4.4% YoY from +4.3% YoY before. It was led by a +5.0% YoY gain in state & local government pay, the most since 1st quarter of 1991.
Many continue to believe upward price pressures can only come off sustainably after the unemployment rate rises painfully – pushing wage inflation down, squeezing incomes, and forcing demand destruction.
Source: Ned Davis Research, Piper Sandler, Axios
That’s all for today.
Blake
Welcome to The Sandbox Daily, a daily curation of relevant research at the intersection of markets, economics, and lifestyle. We are committed to delivering high-quality and timely content to help investors make sense of capital markets.
Blake Millard is the Director of Investments at Sandbox Financial Partners, a Registered Investment Advisor. All opinions expressed here are solely his opinion and do not express or reflect the opinion of Sandbox Financial Partners. This Substack channel is for informational purposes only and should not be construed as investment advice. The information and opinions provided within should not be taken as specific advice on the merits of any investment decision by the reader. Investors should conduct their own due diligence regarding the prospects of any security discussed herein based on such investors’ own review of publicly available information. Clients of Sandbox Financial Partners may maintain positions in the markets, indexes, corporations, and/or securities discussed within The Sandbox Daily. Any projections, market outlooks, or estimates stated here are forward looking statements and are inherently unreliable; they are based upon certain assumptions and should not be construed to be indicative of the actual events that will occur.


