Stocks and rate cuts, plus pricing risk, cost of timing the market, and a 7% yield
The Sandbox Daily (1.24.2024)
Welcome, Sandbox friends.
Today’s Daily discusses:
stocks and rate cuts
pricing of risk
the cost of timing the market
what credit quality does a 7% yield buy?
Let’s dig in.
Markets in review
EQUITIES: Nasdaq 100 +0.55% | S&P 500 +0.08% | Dow -0.26% | Russell 2000 -0.73%
FIXED INCOME: Barclays Agg Bond -0.22% | High Yield -0.05% | 2yr UST 4.384% | 10yr UST 4.178%
COMMODITIES: Brent Crude +0.98% to $80.33/barrel. Gold -0.61% to $2,032.8/oz.
BITCOIN: +0.88% to $39,843
US DOLLAR INDEX: -0.30% to 103.311
CBOE EQUITY PUT/CALL RATIO: 0.57
VIX: +4.70% to 13.14
Quote of the day
“I’ve had a lot of worries in my life, most of which never happened.”
- Mark Twain
Stocks and rate cuts
The Federal Reserve has signaled that it expects to cut rates some time this year. The timing of the 1st cut is up in the air, with Fed Funds Futures pricing in a March or May cut while some Fed officials are implying June is more likely. Regardless, most people agree that absent an inflation resurgence, the Fed is going to lower rates this year.
The stock market tends push higher once the Fed begins cutting, however the phase of the economic cycle does matter.
The Dow Jones Industrial Average has rallied after the 1st cut, higher 6-months later by an average of +9.9% and 12-months by an average of 14.4%.
Back to that important caveat – the economic cycle matters.
Not surprisingly, the Dow Jones has rallied more when a recession has not occurred within a year before or after the 1st cut.
In the year before the 1st cut, the DJIA has lost an average of -4.2% during recession cases versus +6.6% during non-recession cases.
In the year after, the DJIA posted gains regardless of recession or not, although average gains were significantly higher in non-recessions cases (+23.8%) than recessions (+9.8%).
Source: Ned Davis Research
Pricing of risk
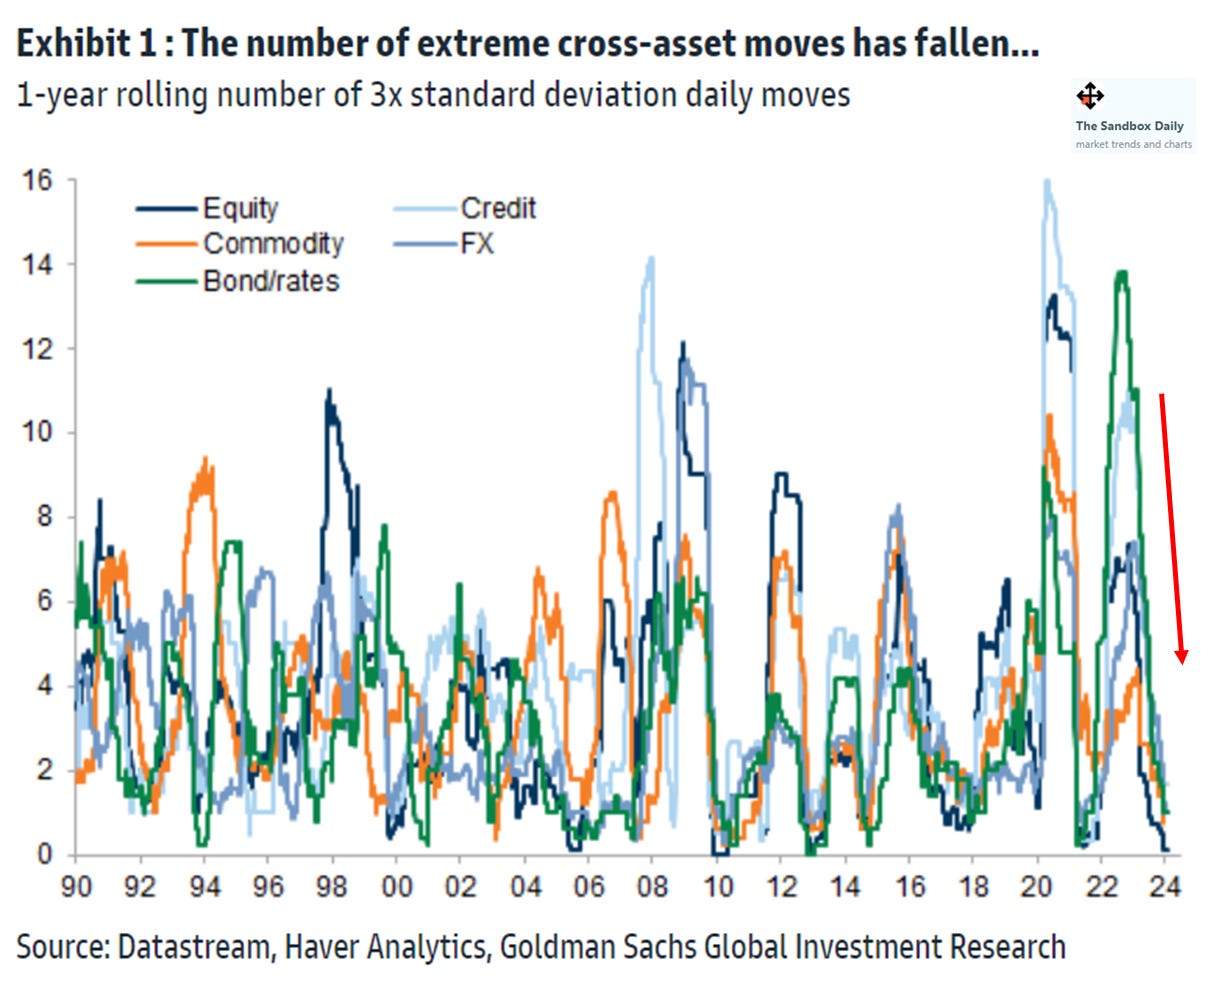
Helped by a better-than-expected global growth/inflation mix, the number of 3x standard deviation daily moves across assets has steadily declined from elevated levels in 2022.
While there was a pick-up of cross-asset volatility around the U.S. regional bank crisis, an elevated starting level of volatility created a higher bar for extreme moves. Since then, cross-asset implied volatility has reset lower – led by equity implied volatility as the VIX reached a 4-year low of 12% in December.
This year equity volatility should remain subdued, helped by low recession risk, a healthy consumer, and continued disinflationary pressures. That said, (geo)political risk has the potential to generate more shocks, especially with multiple elections (including the United States and Europe) and continued conflicts between Russia-Ukraine and escalations in the Middle East.
Rates volatility remains elevated but should trend lower in 2024 due to lower inflation and lesser monetary policy uncertainty as most central banks appear to be at the end of their hiking cycles.
Source: Goldman Sachs Global Investment Research
The cost of timing the market
As they often say, it’s about “time in the market, not timing the market.”
Here are some simple numbers that show how much mistiming the market – even by a few days last year – negatively impacted an investor’s returns.
And the more days you miss, the results get even worse. In fact, had you missed the best 15 or 20 days last year, your S&P 500 investor return flipped from +24% to outright negative.
Source: YCharts
What credit quality does a 7% yield buy?
Although yield fluctuates significantly over time, the credit quality exhibits less variability.
There have been times when an investor could buy AAA quality for a 7% yield while at other times, such as June of 2021, a 7% yield would equate to buying a CCC quality bond. As recently as September 2023, a 7% yield would have bought you a BB+ credit, whereas today it buys you a B+ credit, three full credit notches lower.
Source: Verdad
That’s all for today.
Blake
Welcome to The Sandbox Daily, a daily curation of relevant research at the intersection of markets, economics, and lifestyle. We are committed to delivering high-quality and timely content to help investors make sense of capital markets.
Blake Millard is the Director of Investments at Sandbox Financial Partners, a Registered Investment Advisor. All opinions expressed here are solely his opinion and do not express or reflect the opinion of Sandbox Financial Partners. This Substack channel is for informational purposes only and should not be construed as investment advice. The information and opinions provided within should not be taken as specific advice on the merits of any investment decision by the reader. Investors should conduct their own due diligence regarding the prospects of any security discussed herein based on such investors’ own review of publicly available information. Clients of Sandbox Financial Partners may maintain positions in the markets, indexes, corporations, and/or securities discussed within The Sandbox Daily. Any projections, market outlooks, or estimates stated here are forward looking statements and are inherently unreliable; they are based upon certain assumptions and should not be construed to be indicative of the actual events that will occur.


