

Stocks increasingly going their own way these days, plus Nvidia makes history, central banks, and China
The Sandbox Daily (6.27.2024)

Welcome, Sandbox friends.
Walgreens (WBA) plummeted as much as 25% today (its worst day since the mid-1980s) after the drugstore chain cut profit guidance due to a challenging consumer environment, the trial of Wall Street Journal reporter Evan Gershkovich began yesterday in Russia over superfluous charges he spied on Russian defense contractors, and the NFL has been ordered to pay fans $4.7 billion in damages after a jury found the league violated antitrust laws with its Sunday Ticket (ouch!).
Today’s Daily discusses:
falling correlations give rise to wide dispersion of stock returns
history made with Nvidia
central Bank shrinkage
China’s bifurcated economy, by the numbers
Let’s dig in.
Markets in review
EQUITIES: Russell 2000 +1.00% | Nasdaq 100 +0.19% | S&P 500 +0.09% | Dow +0.09%
FIXED INCOME: Barclays Agg Bond +0.16% | High Yield +0.12% | 2yr UST 4.712% | 10yr UST 4.286%
COMMODITIES: Brent Crude +1.36% to $86.41/barrel. Gold +1.04% to $2,337.2/oz.
BITCOIN: +1.12% to $61,591
US DOLLAR INDEX: -0.13% to 105.919
CBOE EQUITY PUT/CALL RATIO: 0.54
VIX: -2.47% to 12.24
Quote of the day
“Courage is the price that life exacts for granting peace.”
- Amelia Earhart
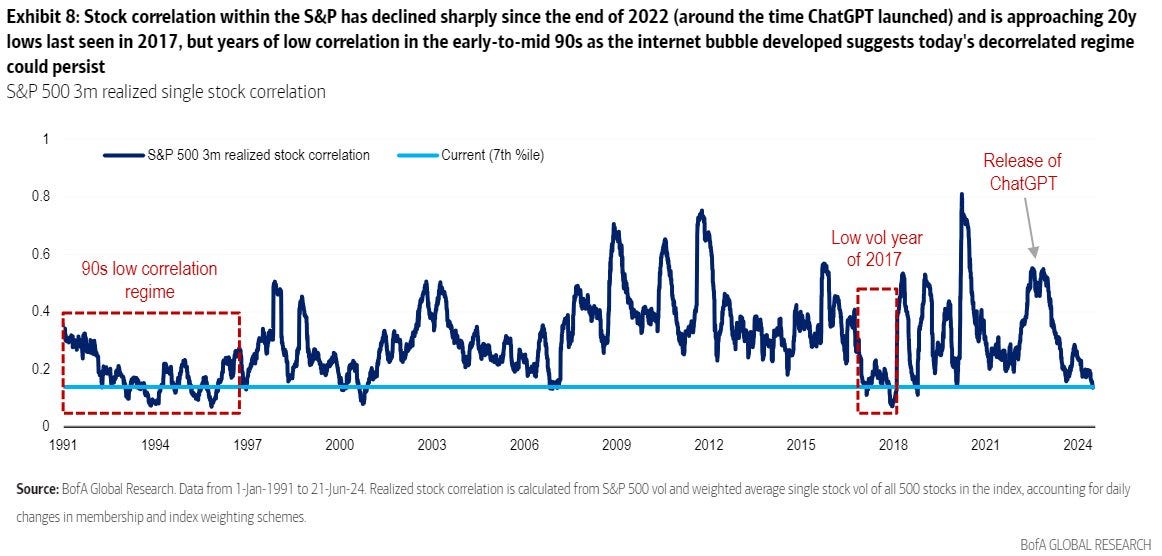
Falling correlations give rise to wide dispersion of stock returns
Stock correlations are exceptionally low right now – hovering around the low end of its mid-term range – and allow for a broad set of opportunities as the stock market is now trading like a market of stocks.
Correlation measures how closely two variables track each other. The range is +1.0 (perfectly positive statistical relationship) to 0.0 (no relationship) to -1.0 (perfect negative relationship).
Individual stocks are increasingly going their own way these days, which gives way to growing divergences between the market’s winners and losers. At the top end of S&P 500 performance, we have Super Micro Computer Inc. (SMCI) price returning +192.4% year-to-date while Nvidia Corp (NVDA) is 2nd at +155.2%; on the other end, the biggest dogs this year are -40.0% for Walgreens Boots Alliance Inc (WBA) and -40.4% for Lululemon Athletica Inc. (LULU).
Under this environment, some active managers will produce outsized returns based on their security selection prowess. It also means that other less fortunate managers will massively underperform benchmarks as stock selection weighs on their performance. Stock picking is a hard business, if you hadn’t heard.
Should investors be on the correct side of chance and choose the “right” active fund, we know from the annual SPIVA report that the chance of that same fund’s persistent and continued outperformance is unlikely because most fail to do so over multiple time frames. The weight of empirical evidence is too great to suggest otherwise.
As S&P Global Intelligence reports:
Exhibit 1 illustrates that the percentage of top-half actively managed domestic equity funds consistently remaining in the top half over a five-year period was less than a random distribution would suggest, evidence that active outperformance, when it occurs, tends to be the result of luck rather than genuine skill.

Source: Gunjan Banerji, S&P Dow Jones Global Intelligence, MarketWatch
History made with Nvidia
Just 12 stocks have led the S&P 500 in total market cap over its illustrious history dating back to 1923, when Standard & Poor’s introduced an index covering 233 companies (it was expanded to its current format in 1957).
The list of companies to take the No. 1 position in the S&P 500 is a storied one full of blue-chips wearing the crown.
See below – the list makes for great trivia questions.

Source: Investor’s Business Daily
Central Bank shrinkage
Since the Federal Reserve began to normalize its balance sheet two years ago, total assets have declined from 36% to 26% of GDP, or ~$1.7T from its peak ($8.9T to $7.2T).

Meanwhile, major central banks outside the United States face even more contractionary balance sheets that have been reduced from 59% to 43% of GDP, or ~$5.5T from the peak.

Despite these Quantitative Tightening (QT) measures, the Fed has been able to prop up liquidity and the monetary base thus far by reducing the size of reverse repo facility. However, the room for additional reduction in reverse repo is limited.
The path to further normalization of the balance sheet would require decline in reserve balances, a source of funding liquidity for Main Street and Wall Street. In this sense, liquidity risks mostly lie to the downside which serve as a low-probability threat to equities.
Source: J.P. Morgan Markets, St. Louis Fed
China’s bifurcated economy, by the numbers
China’s economy, the 2nd largest in the world, remains a bit of an enigma – bifurcated between strength in exports and manufacturing activity, offset by weakness in housing and credit.

It’s right to remain cautious on China’s growth outlook given deteriorating demographics, property and local government deleveraging, deflationary pressures, governance structure/strategy, and global supply chain de-risking.
Source: Goldman Sachs Global Investment Research
That’s all for today.
Blake
Welcome to The Sandbox Daily, a daily curation of relevant research at the intersection of markets, economics, and lifestyle. We are committed to delivering high-quality and timely content to help investors make sense of capital markets.
Blake Millard is the Director of Investments at Sandbox Financial Partners, a Registered Investment Advisor. All opinions expressed here are solely his opinion and do not express or reflect the opinion of Sandbox Financial Partners. This Substack channel is for informational purposes only and should not be construed as investment advice. The information and opinions provided within should not be taken as specific advice on the merits of any investment decision by the reader. Investors should conduct their own due diligence regarding the prospects of any security discussed herein based on such investors’ own review of publicly available information. Clients of Sandbox Financial Partners may maintain positions in the markets, indexes, corporations, and/or securities discussed within The Sandbox Daily. Any projections, market outlooks, or estimates stated here are forward looking statements and are inherently unreliable; they are based upon certain assumptions and should not be construed to be indicative of the actual events that will occur.