

Stock's pullback, plus bitcoin and Facebook's island reversal
The Sandbox Daily (4.25.2024)

Welcome, Sandbox friends.
Tonight’s edition will be shorter than usual – busy day at the office and my Chicago Bears are on the clock.
Today’s Daily discusses:
bullish sentiment sinks, technicals tell the tale
investor interest in spot bitcoin ETFs is off the charts
Facebook’s island reversal
Let’s dig in.
Markets in review
EQUITIES: S&P 500 -0.46% | Nasdaq 100 -0.55% | Russell 2000 -0.72% | Dow -0.98%
FIXED INCOME: Barclays Agg Bond -0.28% | High Yield -0.21% | 2yr UST 5.002% | 10yr UST 4.704%
COMMODITIES: Brent Crude +1.36% to $89.22/barrel. Gold +0.27% to $2,344.6/oz.
BITCOIN: +1.29% to $64,929
US DOLLAR INDEX: -0.26% to 105.577
CBOE EQUITY PUT/CALL RATIO: 0.71
VIX: -3.76% to 15.37
Quote of the day
“Happiness is a mindset for your journey, not the result of your destination.”
- Shawn Achor, The Happiness Advantage
Bullish sentiment sinks, technicals tell the tale
Given the strong market performance to start 2024, equity markets were clearly in overbought territory, as the 14-day relative strength index (RSI) floated above 70 several times throughout January and February.
However, the RSI approached oversold levels last week on Friday – kissing the 30 level – which was its lowest reading since the market low in October 2023. See yellow highlights below.

The corrective action from the last few weeks saw an increasing share of stocks reach oversold levels. In fact, 12% of the S&P 500 index had an RSI that was less than 30 last week, again the highest reading since the market low last fall.
The percentage of S&P 500 index constituents having made new 1-month lows would also suggest that markets were oversold. After the stronger than expected Retails Sales reading last week, we saw new 1-month lows spike to the mid-50% range, which was the highest reading since the October 2023 lows and the regional bank crisis last spring. This is a critical level because historically, when we get new 1-month low readings of 50-60%, equity markets start to trough.

And a tale as old as time, when price corrects, sentiment often follows in spades.
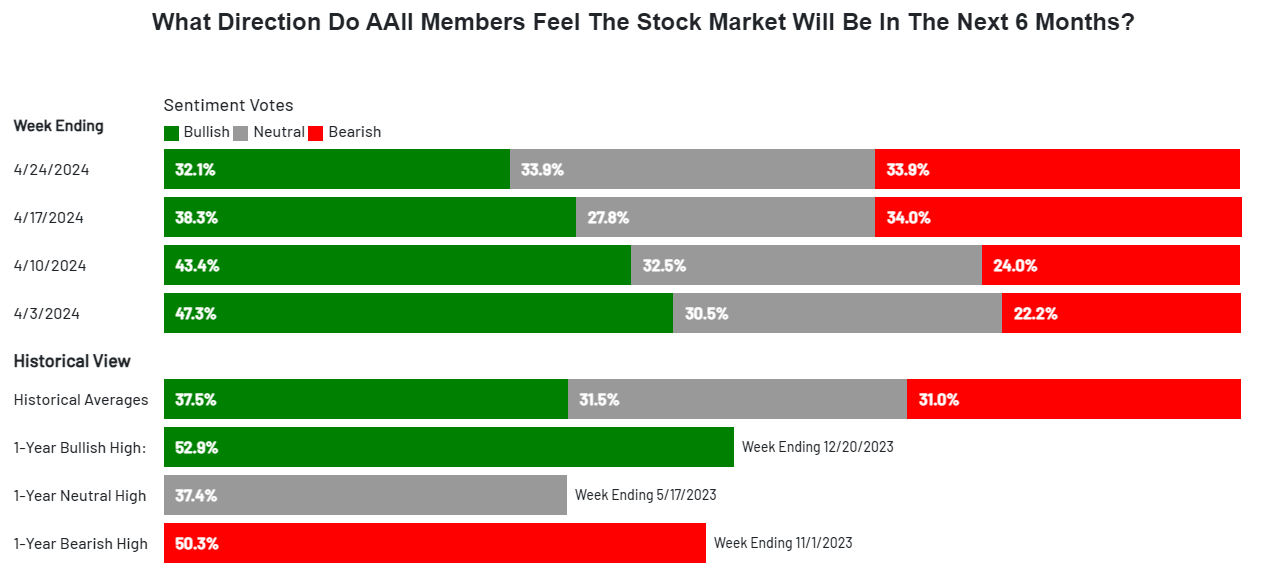
This week – for this 1st time in nearly half a year – bears now outnumber bulls, as the American Association of Individual Investors (AAII) reported that bullish sentiment fell for the 6th time in the last 7 weeks.
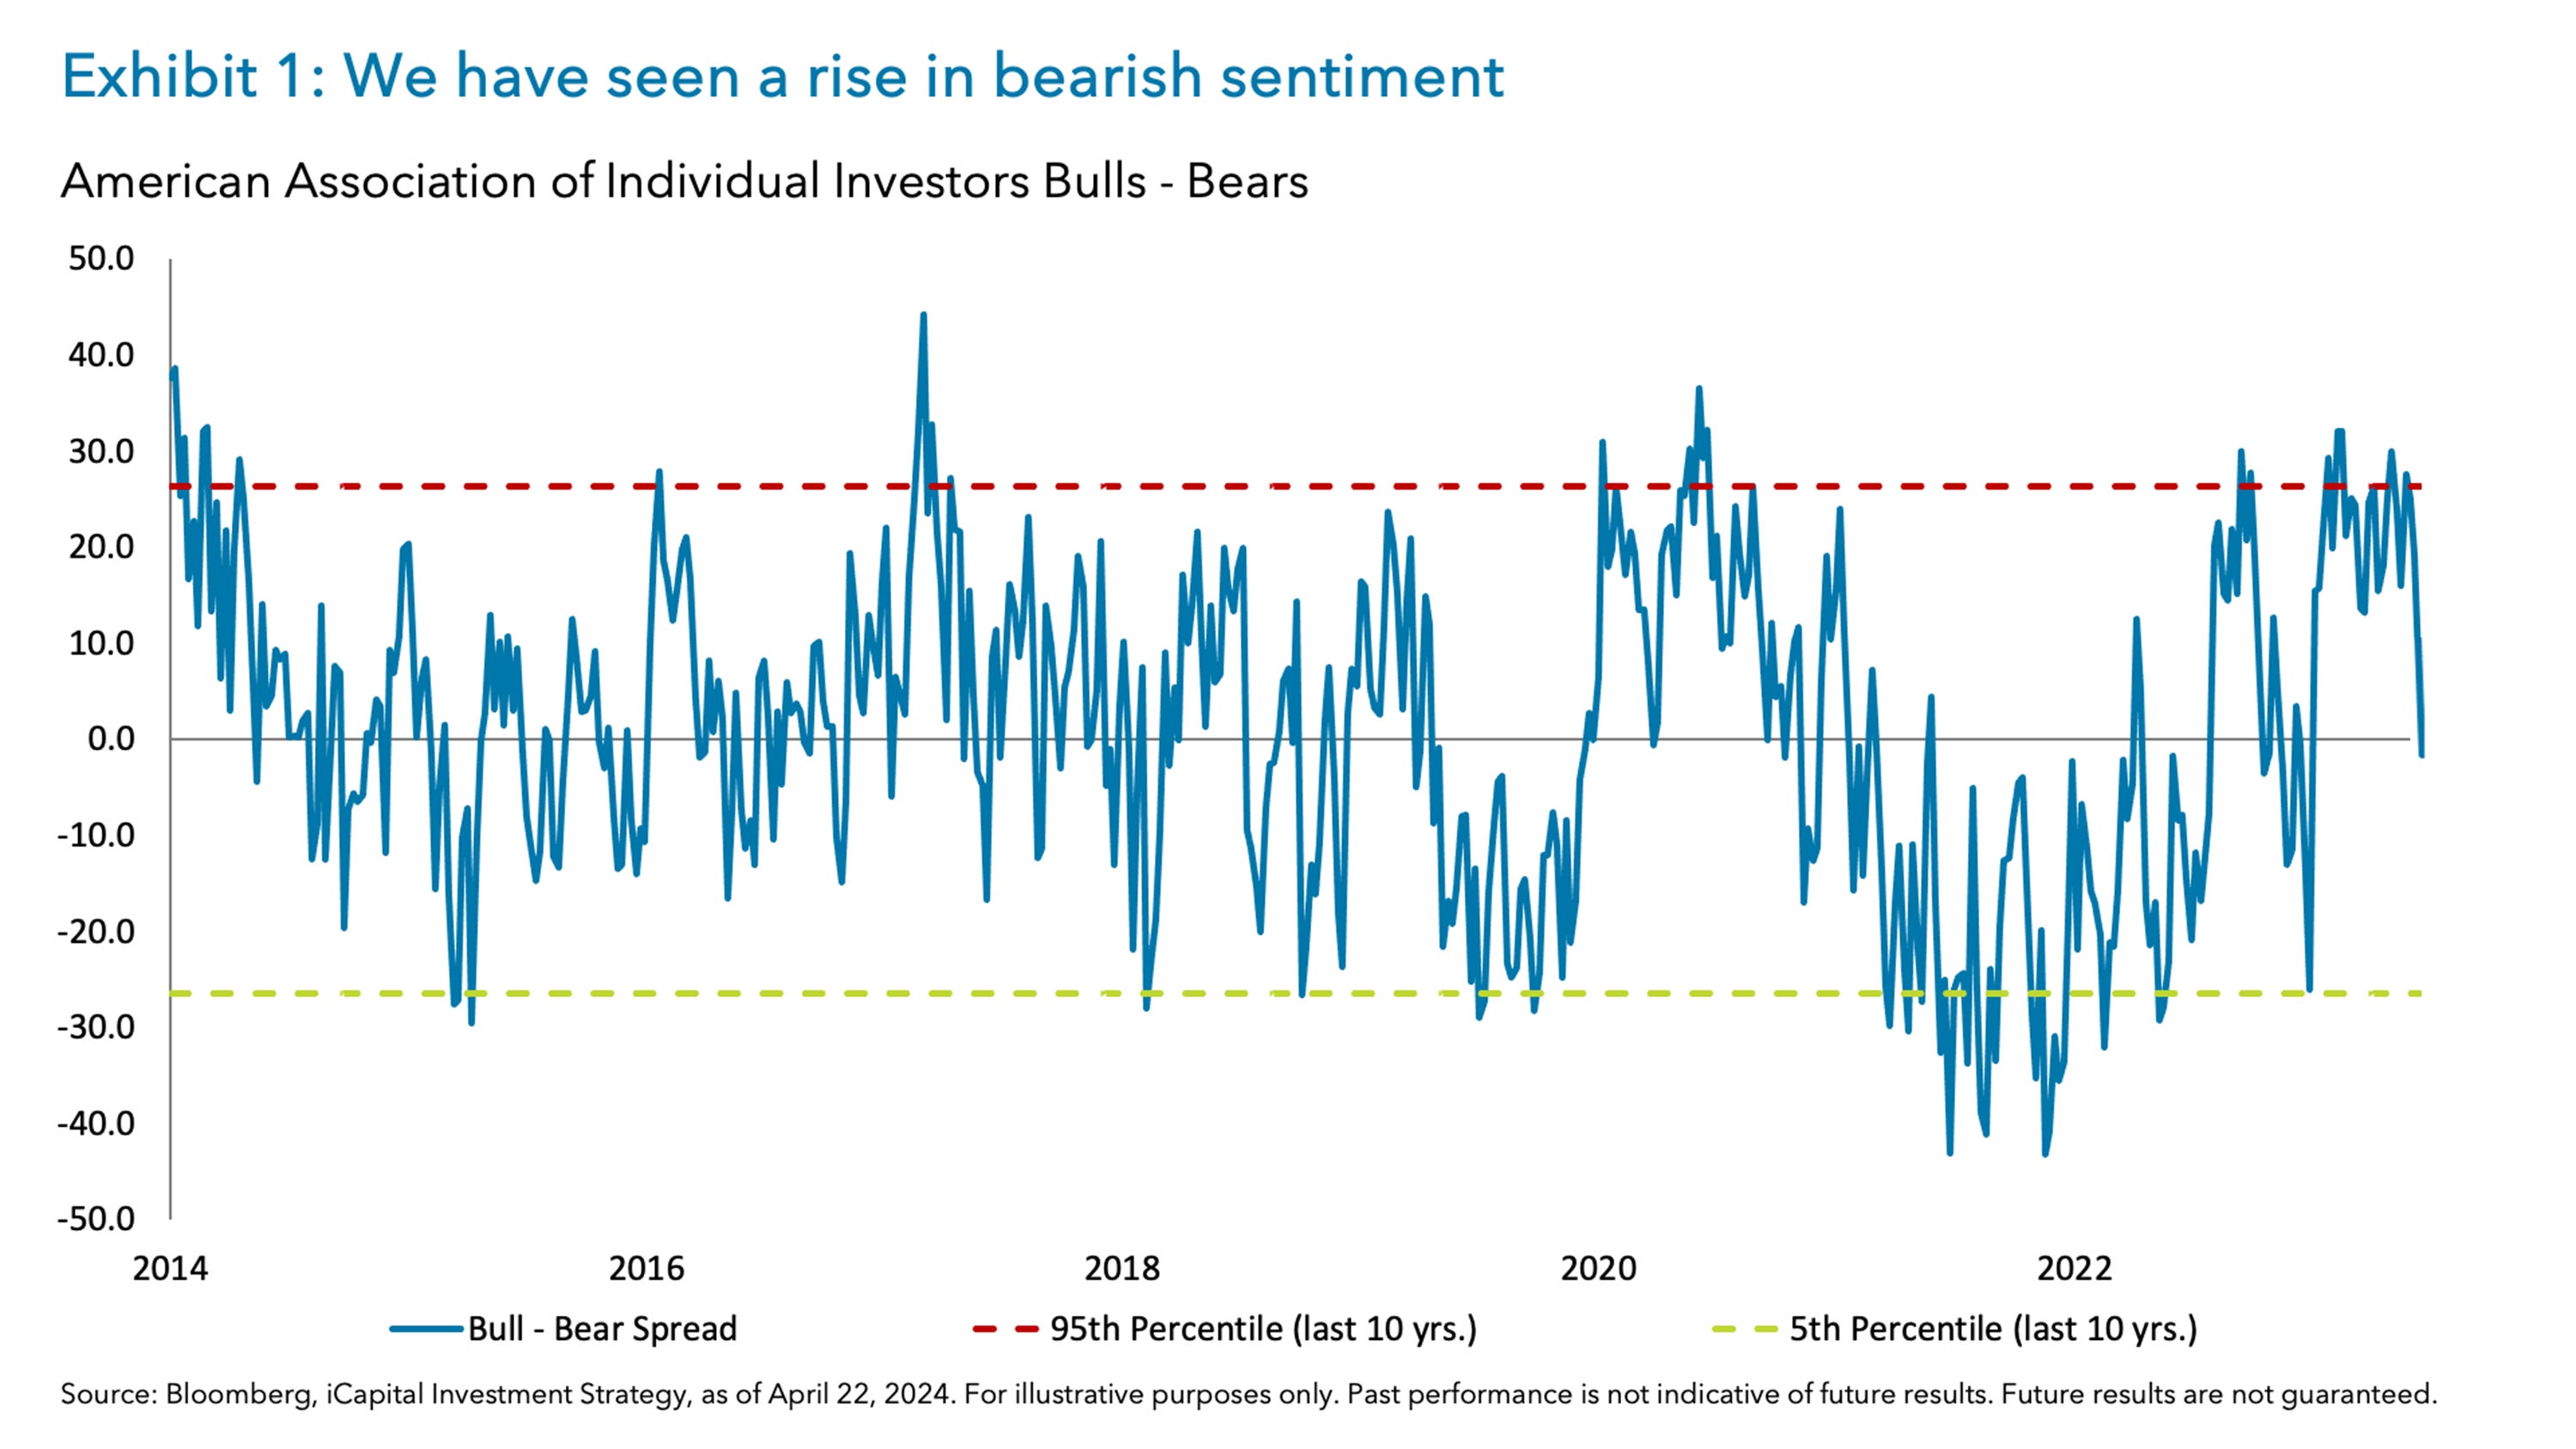
So, in addition to the cleaning up of market technicals, sentiment has also corrected.
The spread between bullish and bearish sentiment has declined rapidly from the 95th percentile over the last 10 years, and now stands at -1.8 – meaning we now have more bears than bulls, a sign that sentiment is getting overly pessimistic.
However, positioning for Commodity Trading Advisors (CTAs) and hedge funds still appears long with potentially more derisking and deleveraging to go, which could deepen the pullback.
This is why buying pullbacks gradually is always prudent – while we await corporate buybacks to resume and investors to step in, counteracting any systematic selling pressure.
Source: Piper Sandler, All Star Charts, Dwyer Strategy, iCapital, American Association of Individual Investors, Bespoke Investment Group
Investor interest in spot bitcoin ETFs is off the charts
It’s tough to deny the investor interest in the spot bitcoin ETFs that launched earlier this year in January.
The leader of the pack – surprise, surprise – is the iShares Bitcoin Trust ($IBIT) courtesy of BlackRock, having amassed $17.6B in assets under management (AUM) in just 3 months’ time.
How impressive is this feat?
IBIT captured net inflows for 71 consecutive trading days, good for top 10 in the longest daily inflow streaks in ETF history. That streak ended today.

BlackRock’s bitcoin offering sucked in assets faster than a Hoover vacuum.
Below is a look at ETFs all-time by assets after the 1st 72 days on the market. It’s bitcoin at the top and nobody’s close. (hint: $FBTC is Fidelity’s bitcoin offering, listed below at #2).

Source: Eric Balchunas (Bloomberg), Sebastien Cabral, BlackRock
Facebook’s island reversal
Technical Analysis (TA) serves many purposes. TA is used in investing circles by analyzing past market data, such as price and volume, to understand market structure, positioning, and investor behavior. It helps investors identify trends, patterns, and potential entry or exit points for trades.
And yet, sometimes the most fun with TA comes from the nomenclature of its chart patterns.
Below, All Star Charts presents the “island reversal,” a chart pattern that indicates a potential trend reversal which can occur at the end of an uptrend.
The island forms with a gap up (Meta’s February 2024 earnings beat), followed by a period of consolidation. The reversal is confirmed when the price gaps down, leaving the island behind (last night’s earnings report).

Source: All Star Charts, Investopedia
That’s all for today.
Blake
Welcome to The Sandbox Daily, a daily curation of relevant research at the intersection of markets, economics, and lifestyle. We are committed to delivering high-quality and timely content to help investors make sense of capital markets.
Blake Millard is the Director of Investments at Sandbox Financial Partners, a Registered Investment Advisor. All opinions expressed here are solely his opinion and do not express or reflect the opinion of Sandbox Financial Partners. This Substack channel is for informational purposes only and should not be construed as investment advice. The information and opinions provided within should not be taken as specific advice on the merits of any investment decision by the reader. Investors should conduct their own due diligence regarding the prospects of any security discussed herein based on such investors’ own review of publicly available information. Clients of Sandbox Financial Partners may maintain positions in the markets, indexes, corporations, and/or securities discussed within The Sandbox Daily. Any projections, market outlooks, or estimates stated here are forward looking statements and are inherently unreliable; they are based upon certain assumptions and should not be construed to be indicative of the actual events that will occur.