Stocks soar, plus sector divergences, home prices, key labor report, and Merriam-Webster's word of the year
The Sandbox Daily (11.30.2022)
Welcome, Sandbox friends.
Today’s Daily discusses the sharp risk-on rally in today’s afternoon trading, sector divergences within the S&P 500 index, home prices slide in September for the 3rd consecutive month, the Job Openings and Labor Turnover Survey (JOLTS) report for October, and Merriam-Webster’s word of the year.
Let’s dig in.
Markets in review
EQUITIES: Nasdaq 100 +4.58% | S&P 500 +3.09% | Russell 2000 +2.72% | Dow +2.18%
FIXED INCOME: Barclays Agg Bond +0.78% | High Yield +1.50% | 2yr UST 4.322% | 10yr UST 3.618%
COMMODITIES: Brent Crude +3.51% to $86.64/barrel. Gold +1.38% to $1,788.1/oz.
BITCOIN: +4.63% to $17,173
US DOLLAR INDEX: -0.87% to 105.873
CBOE EQUITY PUT/CALL RATIO: 0.72
VIX: -5.98% to 20.58
Stocks soar during Powell-ful speech
After a week of sideways and choppy trading on muted volume, Federal Reserve Chairman Jerome Powell’s prepared remarks at the Brookings Institution sent stocks and other risk assets blasting off again.
At 1:30pm when Chairman Powell signaled the Fed will likely slow its pace of rate hikes at the December meeting, turning a small loss for the S&P 500 into a monster gain of +3.09% – its second largest gain this year (after the +5.5% return following the CPI print earlier this month). With today’s gain, the SPX closed at the highest level since mid-September and above its 200-day moving average for the first time since April 7!
The broad-based rally was evident with 93.0% of the S&P 500 traded-volume to the upside (only 20 stocks closed in the red), while overall volume on the New York Stock Exchange surged 84% from yesterday to 6.6 billion shares traded — the highest volume since the September options expiration.
Here is a heat map of the S&P 500 – nice to see some green!
Source: Dwyer Strategy, Stocktwits, Ian McMillan
Divergences
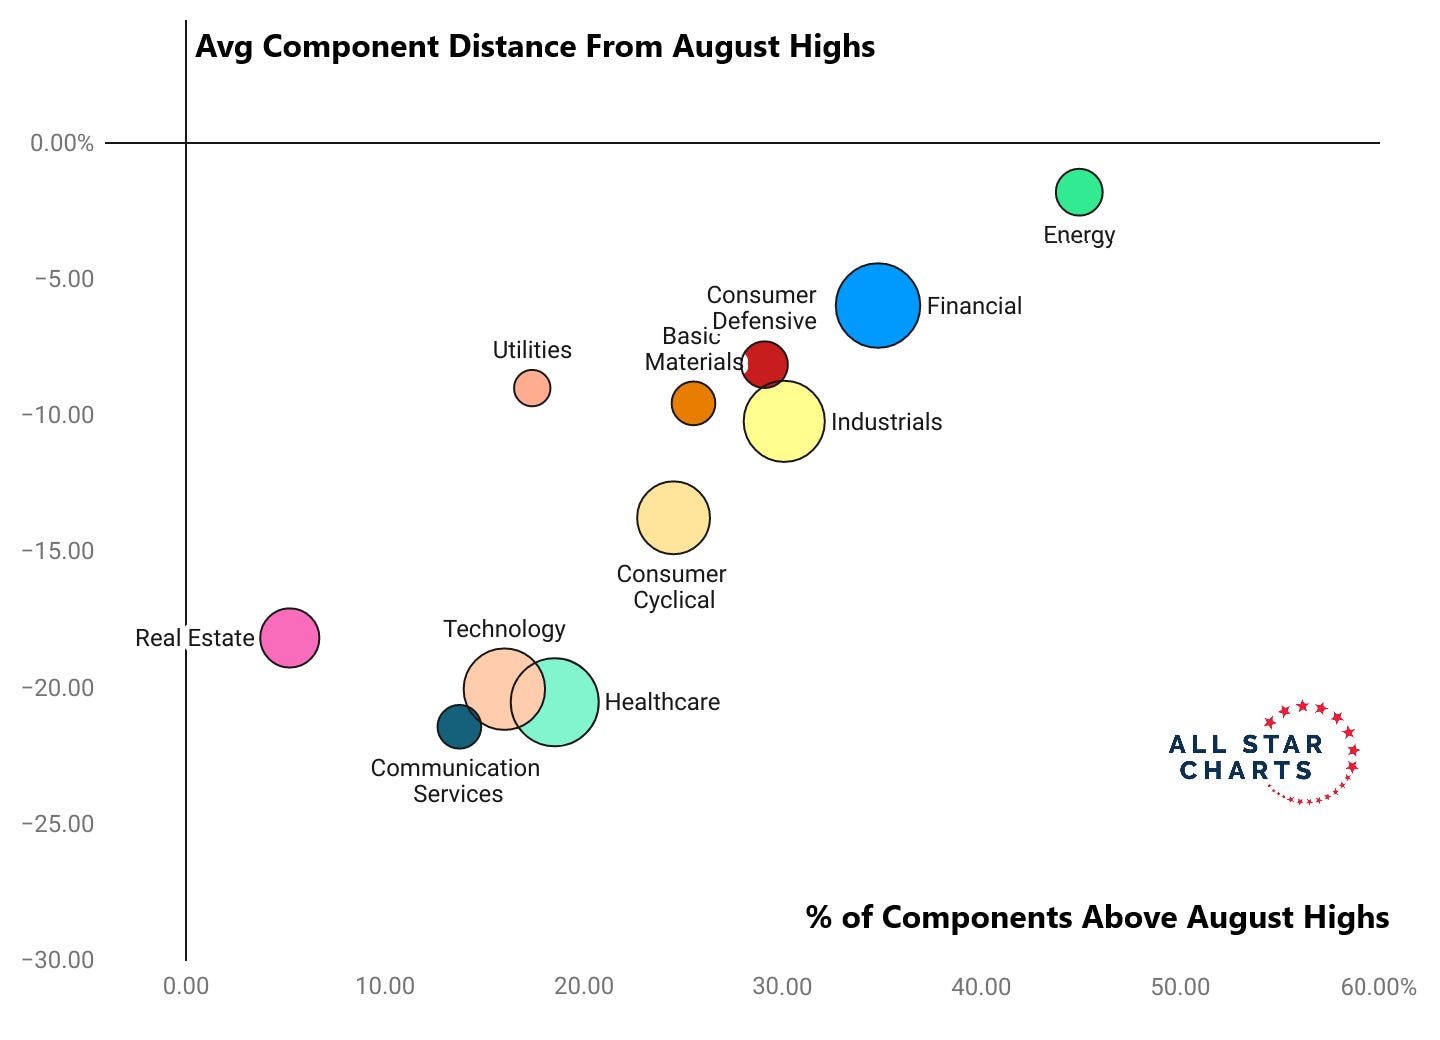
While there have been some real winners during the recent rally, the run up from the October lows has also left many stocks behind.
Value stocks, cyclicals, and blue-chip names have prospered for the past two months, as groups like financials and industrials have been the latest beneficiaries of sector rotation. At the same time, mega-cap technology and the most-speculative growth areas of the market have continued to show relative weakness.
Here’s a table showing the percentage of components by sector above their August highs (when the mid-summer rally rolled over), by sector:
Here’s another way to visualize the same data, with the size of the bubbles determined by the number of components in each sector.
As we’ve witnessed throughout various periods of 2022, divergences are popping up across asset classes, as well as within.
Source: All Start Charts
Home prices slide in September for 3rd straight month
Home prices fell in September from the prior month, marking 3 months of sequential price declines after 126 straight monthly increases that began in January 2012.
The S&P CoreLogic Case-Shiller National Home Price Index, which measures home prices across the nation, fell -1% in September from August. Over the past three months, the index is down -2.6%.
Home prices are still rising on an annual basis because the inventory of homes for sale are at unusually low levels. In September, the index rose +10.6% on an annualized basis compared with a year earlier, down from a +12.9% rate the prior month.
Home prices in many major cities had been booming for years before the pandemic-fueled home buying spree pushed prices even higher. That surge reversed abruptly this year due to a rapid rise in mortgage rates, which made home-buying far less affordable and pushed many buyers out of the market.
Source: Calculated Risk, S&P CoreLogic Case-Shiller Home Price Indices, Charlie Bilello
Tight labor market shows some signs of easing
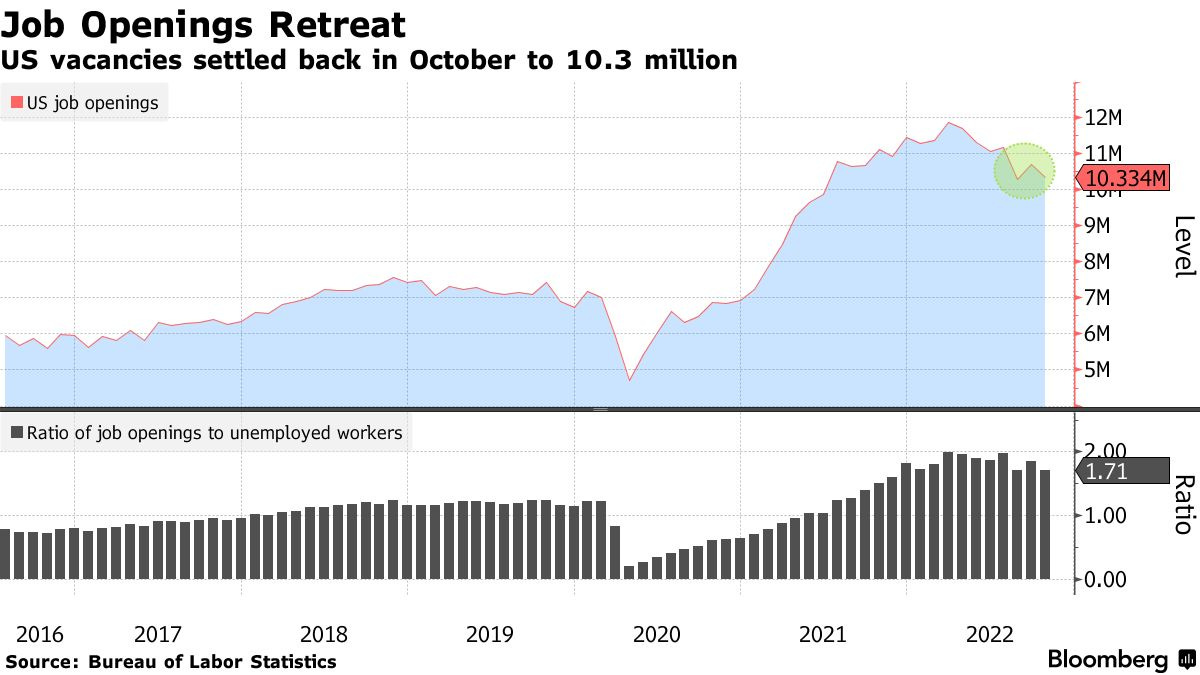
U.S. job openings fell in October, reversing a surprise jump in the prior month, in a hopeful sign for the Federal Reserve as it seeks to curb demand across the economy. Job openings ticked down -3.3% in October to 10.3 million, reversing most of the gain in the prior month. While the number of open positions has come down from its peak level of 11.9 million in March of this year, it is still much higher than pre-pandemic when it was around 7.0 million.
The job openings-to-unemployed ratio has come down only modestly from a peak level of 1.92 earlier this year to 1.71 presently, a sign that labor market conditions remain tight. It implies that wage pressures will take a while to recede from their currently elevated rate, which may keep labor inflation high for longer.
Some 4 million Americans quit their jobs in October as the quit rate slipped to 2.6% from 2.7% in the prior month and a peak rate of 2.9% earlier in this cycle. Economic uncertainty paired with recent layoff announcements at several large companies also appeared to have made Americans more hesitant to leave their current roles.
The layoff rate was unchanged at 0.9%, matching its second lowest level on record, as businesses held onto their current staff.
Source: Bureau of Labor Statistics, Bloomberg, Ned Davis Research
Merriam-Webster’s word of the year
“Gaslighting” is Merriam-Webster’s word of the year for 2022.
2022 saw a +1740% increase in lookups for gaslighting, with high sustained interest throughout the year. The selection process is based solely on data, according to the company.
In recent years, with the vast increase in channels and technologies used to mislead, gaslighting has become the favored word for the perception of deception.
Here are the two formal definitions per MW:
psychological manipulation of a person usually over an extended period of time that causes the victim to question the validity of their own thoughts, perception of reality, or memories and typically leads to confusion, loss of confidence and self-esteem, uncertainty of one's emotional or mental stability, and a dependency on the perpetrator
the act or practice of grossly misleading someone especially for one's own advantage
Source: Merriam-Webster
That’s all for today.
Blake
Welcome to The Sandbox Daily, a daily curation of relevant research at the intersection of markets, economics, and lifestyle. We are committed to delivering high-quality and timely content to help investors make sense of capital markets.
Blake Millard is the Director of Investments at Sandbox Financial Partners, a Registered Investment Advisor. All opinions expressed here are solely his opinion and do not express or reflect the opinion of Sandbox Financial Partners. This Substack channel is for informational purposes only and should not be construed as investment advice. Clients of Sandbox Financial Partners may maintain positions in the markets, indexes, corporations, and/or securities discussed within The Sandbox Daily.


