Tariff roulette: the new reality of global trade
The Sandbox Daily (7.16.2025)
Welcome, Sandbox friends.
Today’s Daily discusses:
tariff roulette: where it lands, nobody knows
Let’s dig in.
Blake
Markets in review
EQUITIES: Russell 2000 +0.99% | Dow +0.53% | S&P 500 +0.32% | Nasdaq 100 +0.10%
FIXED INCOME: Barclays Agg Bond +0.14% | High Yield +0.26% | 2yr UST 3.896% | 10yr UST 4.459%
COMMODITIES: Brent Crude +0.04% to $68.74/barrel. Gold +0.52% to $3,354.2/oz.
BITCOIN: +2.59% to $119,987
US DOLLAR INDEX: -0.33% to 98.294
CBOE TOTAL PUT/CALL RATIO: 0.83
VIX: -1.27% to 17.16
Quote of the day
The weakest wolf in the pack said: "One day I will be the strongest." Everyone laughed – except the strongest.
Tariff roulette: where it lands, nobody knows
If you’re head is spinning from tariffs, you’re not alone.
One day they are on, the next day off. First it’s steel and aluminum, next it’s copper. Canada is at 25% with the President threatening 35%, then again the Canadian baseline tariff includes significant exemptions – so check the itemized list once or twice. Maybe we’ll strike a deal with Mexico, maybe not. How will Europe respond to the President’s letter? Why did the July 9 deadline move to August 1? Why strike terms with Indonesia before a key trading partner like Japan?
On and on and on.
Where does it end?
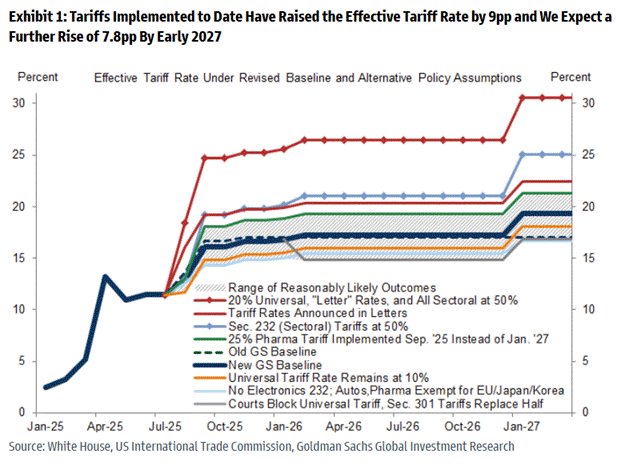
Just trying to make sense of it all has your head spinning. Goldman did a fairly decent job below but still…
After TACO-ing postponing the July 9 tariff deadline to August 1, President Trump has proposed higher tariffs on countries accounting for 3/4 of U.S. imports, while also suggesting the baseline tariff rate on other trading partners might rise from 10% to 15-20%. Those are the recent highlights that caught my attention.
Economic forecasting has been an increasingly tough job due to this ever-evolving tariff landscape.
A major source of confusion has been the difference between statutory (or announced) tariff rates and effective tariff rates.
For example, the tariff paid by importers may be 25%, but when you calculate the effective rate by dividing tariff revenues by import values, it often appears lower. This happens due to real-world complexities such as exemptions, quotas, shipping delays, and product mix shifts.
JPMorgan put together a chart illustrating the significant changes in both statutory and effective tariff rates since the start of the year.
The gap between these rates is wide due to implementation delays and a dramatic shift in import composition, both by product and country.
Imports from China, subject to the highest tariffs at an estimated effective rate of 40%, have plummeted – decreasing by 24% YoY from just March to May this year.
In contrast, imports from the Eurozone – now facing an effective tariff of approximately 10% – have surged, largely driven by the frontloading of products like pharmaceuticals. Data is showing that importers are actively seeking substitutes from other countries to circumvent these tariffs.
Then take the recent negotiations with Vietnam, which initially raised hopes for lower rates. Instead, the deal ended with a 20% tariff on products originating in Vietnam, higher than the previously announced 10% during the 90-day pause.
This country-specific outcome makes other negotiations look less promising.
Oh, one more wrinkle.
The Section 232 “investigations” have almost concluded, indicating more sectoral tariffs could be introduced in the coming weeks and months.
The terminal tariff rate remains highly fluid and definitively uncertain, but a higher rate than consensus is becoming more and more likely. All the moving pieces make economic trade and business decisions all the more difficult.
Investors at home must get accustomed to actively managing their exposure to affected regions and companies.
Sources: Goldman Sachs Global Investment Research, JPMorgan
That’s all for today.
Blake
Questions about your financial goals or future?
Connect with a Sandbox financial advisor – our team is here to support you every step of the way!
Welcome to The Sandbox Daily, a daily curation of relevant research at the intersection of markets, economics, and lifestyle. We are committed to delivering high-quality and timely content to help investors make sense of capital markets.
Blake Millard is the Director of Investments at Sandbox Financial Partners, a Registered Investment Advisor. All opinions expressed here are solely his opinion and do not express or reflect the opinion of Sandbox Financial Partners. This Substack channel is for informational purposes only and should not be construed as investment advice. The information and opinions provided within should not be taken as specific advice on the merits of any investment decision by the reader. Investors should conduct their own due diligence regarding the prospects of any security discussed herein based on such investors’ own review of publicly available information. Clients of Sandbox Financial Partners may maintain positions in the markets, indexes, corporations, and/or securities discussed within The Sandbox Daily. Any projections, market outlooks, or estimates stated here are forward looking statements and are inherently unreliable; they are based upon certain assumptions and should not be construed to be indicative of the actual events that will occur.
Please see additional disclosures (click here)
Please see our SEC Registered firm brochure (click here)
Please see our SEC Registered Form CRS (click here)


