The average stock has gone nowhere over last 25 years
The Sandbox Daily (6.2.2023)
Welcome, Sandbox friends.
Today’s Daily discusses:
the base of all bases
the critical jobs day in America!
7 stocks > 4 sectors
credit card delinquency rates are moving higher
a brief recap to snapshot the week in markets
It’s summer Friday. Hope everyone has a great weekend – work hard, play hard !!
Let’s dig in.
Markets in review
EQUITIES: Russell 2000 +3.56% | Dow +2.12% | S&P 500 +1.45% | Nasdaq 100 +0.73%
FIXED INCOME: Barclays Agg Bond -0.53% | High Yield +0.51% | 2yr UST 4.512% | 10yr UST 3.698%
COMMODITIES: Brent Crude +1.93% to $76.21/barrel. Gold -0.56% to $1,964.3/oz.
BITCOIN: +0.93% to $27,170
US DOLLAR INDEX: +0.46% to 104.021
CBOE EQUITY PUT/CALL RATIO: 0.58
VIX: -6.71% to 14.60 (!!)
Quote of the day
“Interest is the difference in monetary values across time, the rate at which present consumption is exchanged for future consumption. Interest represents the time value of money. The earliest allusion to time having value has been attributed to a fragment of the Greek orator Antiphon (480-411 BC) which states that “the most costly outlay is time.” Five centuries later, Seneca the Younger reminds his friend Lucillius that time is precious because man is mortal and his days are numbered. “Embrace every hour,” he advises. "The stronger hold you have on today, the less will be your dependence on tomorrow.”
- Edward Chancellor, The Price of Time: The Real Story of Interest
The base of all bases
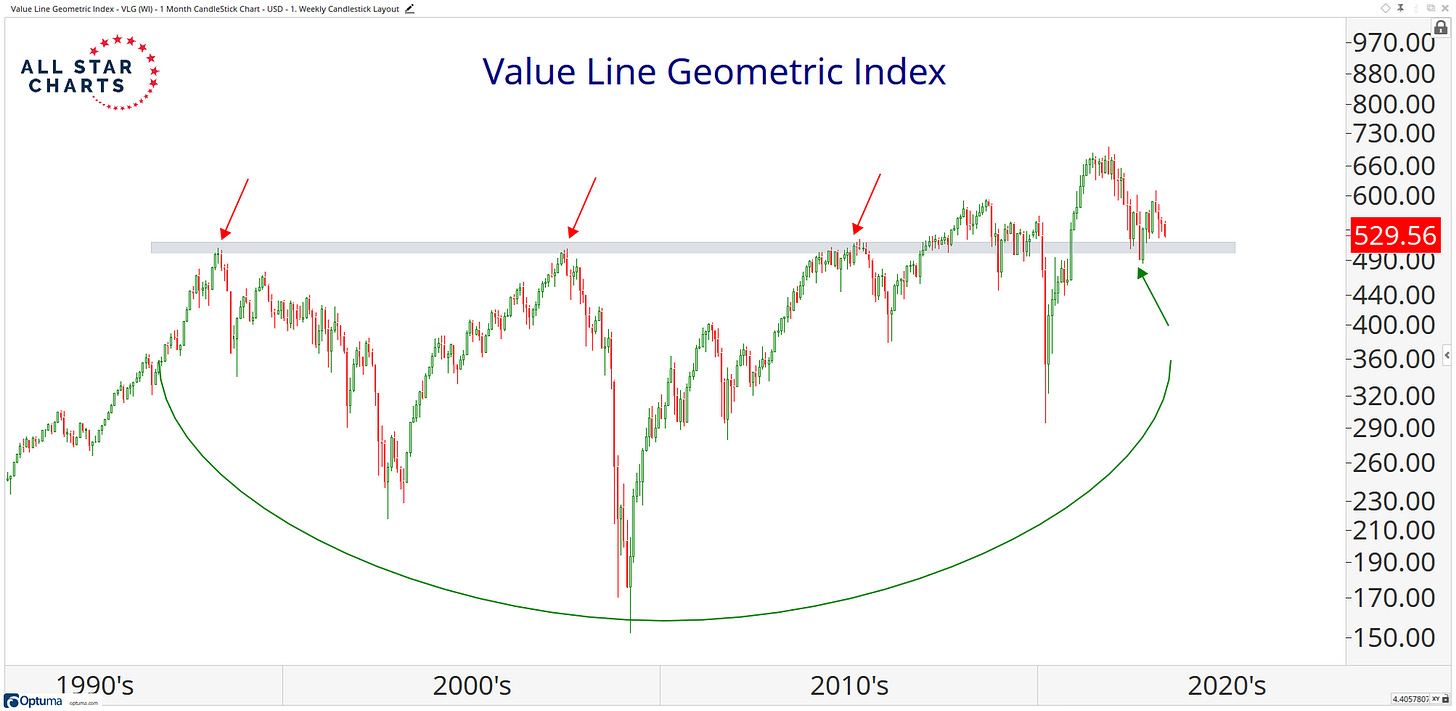
The Value Line Geometric Index, which is comprised of roughly 1,700 equities listed in the U.S. and Canada, measures the price change of the median stock. For this reason, it is as good a representation as any of how the average stock is performing.
Looking at the Value Line Geometric Index ETF (VLG), the chart shows us that the majority of the broader market has made no progress at all for about 25 years. Here are the monthly candlesticks dating back to the early 1990s:
A lot has been made about big bases this year. This is because so many stocks endured nasty drawdowns over the past few years and have spent the past few quarters consolidating and trying to build bottoms.
As we prepare ourselves for an environment that could be characterized by some much-needed corrective action, our focus falls on the weakest groups and indexes. Because the Value Line is agnostic to the market cap-weight issues of most indexes, it paints a more accurate picture of what the broader market is doing. And as you can see, the overall market hasn’t performed anything like the S&P 500 and Nasdaq 100 in recent history.
Source: All Star Charts
Jobs day!
The labor market just won’t quit.
May saw another big upward surprise in payroll gains, with employers adding 339,000 jobs versus the expected 195,000. The increases were widespread, with notable upticks in professional and business services, government, and health care. The large April gains were revised even higher (294,000), another signal of labor market strength. The U.S. labor market is now averaging 314,000 net new jobs per month in 2023 – not what the Fed is likely hoping for.
Meanwhile, the unemployment rate ticked higher from 3.4% to 3.7% – the biggest monthly increase since November 2010 (excluding the two months during the pandemic).
Elsewhere, wages decelerated. Average hourly earnings rose +0.3%, although the year-on-year change fell from 4.35% to 4.30% and well off the cycle’s high of 5.92% YoY we saw in March 2022.
The tight labor market has raised concerns about the role of wage costs/pressures in persistently high inflation readings, which has the Fed’s acute attention. We know that companies pass this along to customers in the form of higher prices. So, reduced wage pressures from this tight labor market give the Federal Reserve room to pause in its rate hiking cycle.
Market odds still point to an interest rate hike pause/skip at the upcoming June meeting.
Source: Ned Davis Research, Bloomberg, CNBC
7 stocks > 4 sectors
The seven largest companies now have a market cap greater than the Energy, Materials, Industrials, and Financials sectors combined.
There is conflicting data as to what this portends for forward returns, but in terms of market structure, it does help explain why cap-weighted performance is far outpacing equal-weighted performance in 2023!
Source: Ned Davis Research
Credit card delinquency rates are moving higher
Metrics regarding the health of our economy are more mixed than I can ever recall.
For example, the sharp upturn in interest rates has cooled off the housing market and put pressure on the banks, leading to a tightening of credit (if not a full-blown credit crunch). That would indicate a looming recession, except unemployment is low, the job market is tight, corporate balance sheets are strong, and flights and hotels are full.
For those more bearish in their outlook, here’s one data point indicating a weakening consumer – the biggest contributor to GDP. Delinquency rates for credit card borrowers are approaching 2008 levels across all age categories and most pronounced at the lower age cohorts.
Credit card debt recently hit a record $1 trillion in the U.S. But what's more concerning? That number has increased by +$250 billion in just 2 years. The average household carries $10,000 on their card – another record.
Source: Apollo Global Management, St. Louis Fed
The week in review
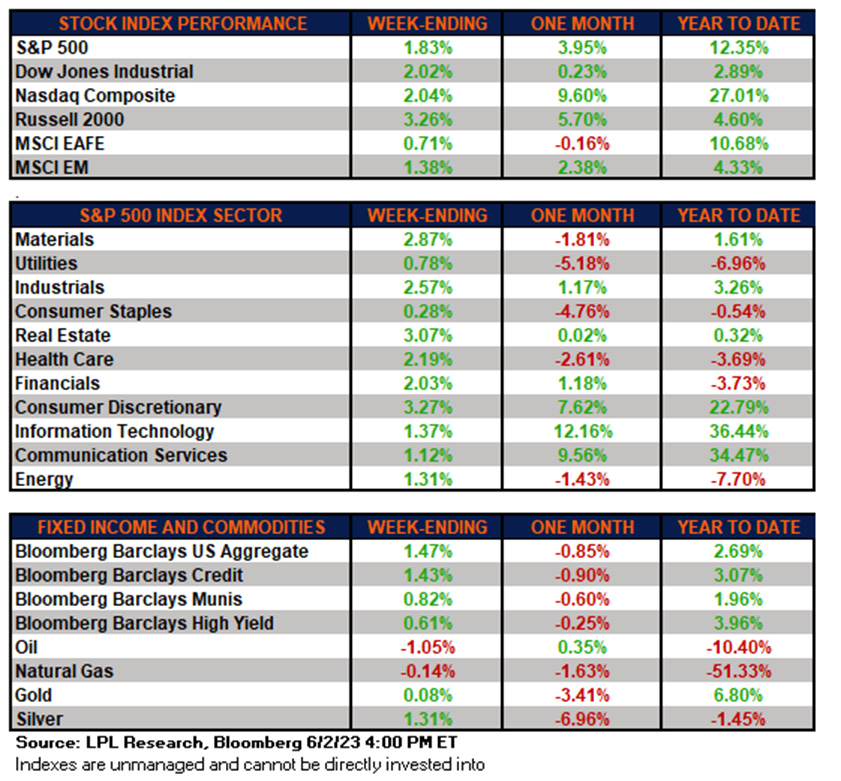
Talk of the tape: For the 2nd month in a row, both the S&P 500 and the NASDAQ 100 indices have finished at new 12-month highs, while the Dow Jones Industrial Average and Russell 2000 indices claw their way back into positive year-to-date performance. This weeks broad participation, especially from value and cyclical segments, have been a welcome addition.
Recent positives have revolved around disinflation traction, the near-term Fed pause narrative, removal of the debt ceiling overhang, earnings cushions from supply chain and input cost normalization, corporate commentary highlighting a still fairly resilient U.S. consumer, further support for soft-landing expectations from solid labor market data, and renewed China stimulus speculation. In addition, there has been some select pushback against concerns about weak breadth and a looming liquidity drag, two of the biggest bearish talking points.
Fedspeak continues to lean hawkish with the market now leaning towards a pause at the upcoming meeting on June 14th – electing to skip a rate hike at this FOMC meeting and wait to digest more economic data before deciding on the next step for monetary policy.
Stocks: Equities finished the week higher across the board. This week’s approved debt ceiling agreement along with the possibility that the Federal Reserve is done tightening rates helped propel stocks.
For the last couple of months, the S&P 500 has been mostly range bound between 4,000 and 4,200. With the index breaking through overhead resistance, investors are wondering what propels the market higher from here. Market breadth has also been notably weak, with only about 40% of index constituents trading above their 200-day moving average.
Bonds: The Bloomberg Aggregate Bond Index finished higher as bond prices increased while yields declined. Investment grade corporate debt underperformed the broader Bloomberg Aggregate Bond Index in May with the utility sector as the biggest laggard. Despite the ongoing concerns about financial institutions, the financials sector outperformed the other broader sectors.
Commodities: Energy prices finished lower this week while the major metals (gold, silver, and copper) finished the week on a positive note. The Bloomberg Commodities Index has fallen 13% year to date, led by a decline in natural gas (-58%) and industrial metals (-15%), with precious metals (+5%) finding some support.
The case for commodities as an inflation hedge is less compelling with inflation likely to continue its steady decline in the months ahead.
Source: Dwyer Strategy, LPL Research
That’s all for today.
Blake
Welcome to The Sandbox Daily, a daily curation of relevant research at the intersection of markets, economics, and lifestyle. We are committed to delivering high-quality and timely content to help investors make sense of capital markets.
Blake Millard is the Director of Investments at Sandbox Financial Partners, a Registered Investment Advisor. All opinions expressed here are solely his opinion and do not express or reflect the opinion of Sandbox Financial Partners. This Substack channel is for informational purposes only and should not be construed as investment advice. Clients of Sandbox Financial Partners may maintain positions in the markets, indexes, corporations, and/or securities discussed within The Sandbox Daily.


