

The cycle of market emotions, plus demand for gold, yield curve inversions, and crypto losses mount
The Sandbox Daily (11.22.2022)

Welcome, Sandbox friends.
Today’s Daily discusses the cycle of market emotions, the strong demand for gold reserves from central banks, the predictive power of yield curve inversions for market performance and recessions, and crypto’s steep losses continue to mount.
Let’s dig in.
Editor’s note: Thanksgiving
The Sandbox Daily will be on hiatus for the celebration of Thanksgiving and will return on Monday, November 28th. We hope you have a wonderful day with family and friends.

Markets in review
EQUITIES: Nasdaq 100 +1.48% | S&P 500 +1.36% | Dow +1.18% | Russell 2000 +1.16%
FIXED INCOME: Barclays Agg Bond +0.52% | High Yield +0.73% | 2yr UST 4.523% | 10yr UST 3.758%
COMMODITIES: Brent Crude +1.07% to $88.39/barrel. Gold +0.05% to $1,755.5/oz.
BITCOIN: +3.64% to $16,126
US DOLLAR INDEX: -0.62% to 107.162
CBOE EQUITY PUT/CALL RATIO: 0.64
VIX: -4.79% to 21.29
The market cycle of emotions
Creating an investment strategy is easy. Sticking with it is hard.
At the end of the day, we’re all human and beholden to our emotions.
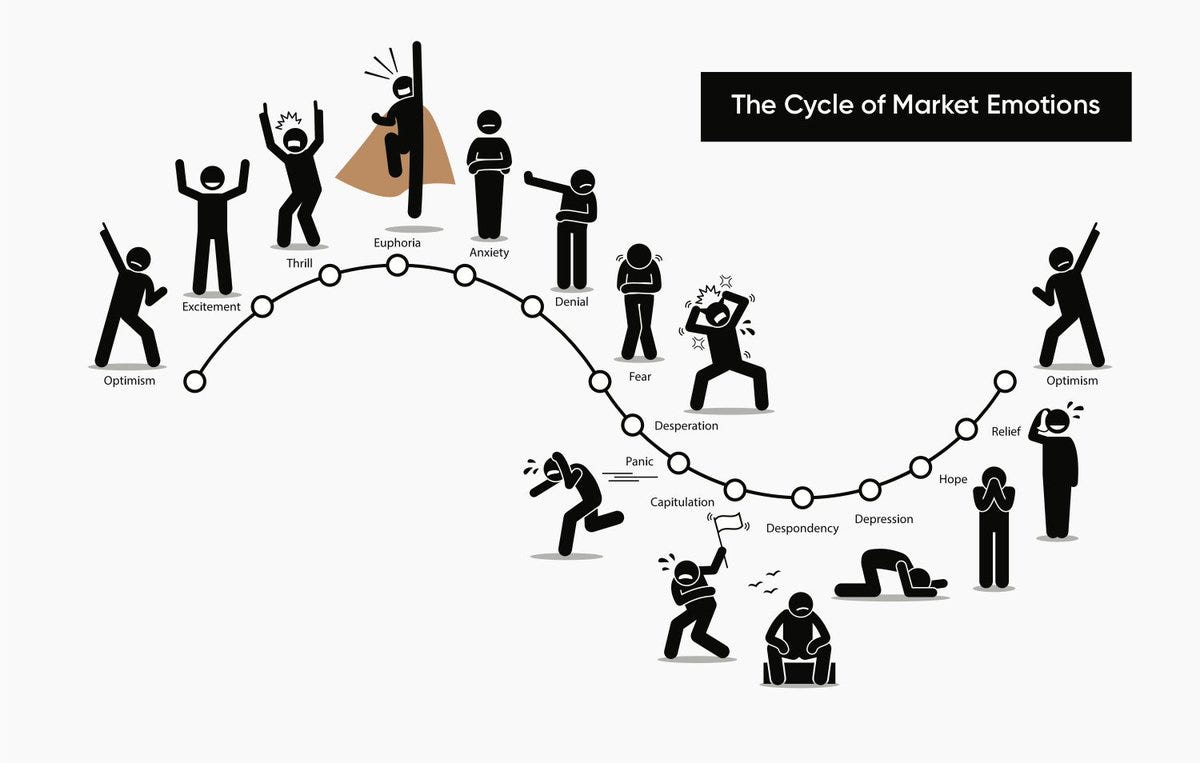
Source: Brian Feroldi
The search for a new monetary anchor has begun
To avoid becoming further entwined with the Western financial system and the reliance on the strong U.S. dollar, it’s not surprising that some central banks have been adding to their gold holdings. But the amount was shocking – nearly 400 metric tons in Q3, which was more than double Q2’s robust addition of 186 tons and the most since at least 2000, according to the World Gold Council. It was almost double the previous record from four years ago. In the first three quarters of the year, net purchases totaled 673 tons, surpassing all annual totals since 1967, when the U.K. devalued the pound by 14%.

Source: Ned Davis Research
The predictive power of yield curve inversions
The shape of the U.S. Treasury yield curve is often looked at as a barometer for U.S. economic growth. More specifically, it reflects how the Federal Reserve (Fed) intends to stimulate or slow economic growth by cutting or raising its policy rate. Each tenor on the curve is roughly the expected policy rate plus or minus a term premium (the term premium represents the expected compensation for lending for longer periods of time). In “normal” times, the yield curve is upward sloping, meaning longer maturity Treasury yields are higher than shorter maturity Treasury yields to compensate the lender for the risk of time. However, when – like now – inflationary pressures are apparent and the Fed wants to slow aggregate demand, shorter maturity securities could eventually out-yield longer maturity securities, inverting the yield curve.
The predictive record of yield curve inversion depends on which parts of the yield curve are inverted. Two popular yield curve indexes are the differences between the 2-year Treasury yield and the 10-year Treasury yield (2Y/10Y), and the 3-month T-Bill and the 10-year Treasury yield (3M/10Y). Of these two, the 2Y/10Y is the most popular within the financial media (likely because it tends to invert before the 3M/10Y), but the predictive signal of the 3M/10Y has been more robust.

The past 6 times the 2Y/10Y part of the yield curve inverted, a recession followed 18 months later on average. However, the length of time between the quickest time to recession (6 months) and the longest time until recession (34 months!) complicates the signal and in the Fed’s words, the relationship is probably spurious.

As such, the Fed tends to put more credence on the 3M/10Y, which has had a better track record in predicting recessions with a lead time of about 4-6 quarters, but as few as 2 quarters ahead. The 3M/10Y signal has predicted essentially every U.S. recession since 1950, with only one “false” signal, which preceded the credit crunch and slowdown in production in 1967. When looking at stock performance around yield curve inversions, the results are mixed when looking at one-year time horizons.

Further, a signal that lasts only one day may be dismissed, but a signal that persists for a month or more should be looked at carefully. The current 3M/10Y inversion began in earnest in October, so using historical data as a guide and according to this quantitative metric, we’re likely at least two quarters away from recession. Finally, it’s also important to note that yield curve inversion does not provide much evidence in terms of length and/or magnitude of a potential recession. Over time, we’ve seen deep inversions with shallow recessions and shallow inversions with deep recessions. The signal only provides information on if a recession is likely over the next few quarters.
Source: Federal Reserve Bank of St. Louis, LPL Research
Crypto’s steep losses continue to mount
Bitcoin's 78% drawdown over the last year is its largest since 2017-2018 and, at 376 days, is now the 2nd longest, trailing only the 2013-15 decline of 410 days.

And here are the last 10 years of the total market capitalization for crypto:

The fallout from the FTX bankruptcy filing continues. One example is this 2028 Coinbase corporate bond.
On April 14, 2021, shares of Coinbase, a cryptocurrency broker/custodian, were first publicly traded. The shares peaked at $429.50 a share that day, well above the reference point of $250 set the night before. Since peaking in its first hours of trading, Coinbase has grossly underwhelmed expectations. Coinbase shares are now down nearly -90% from the intraday peak and under severe pressure due to FTX's bankruptcy and the poor performance of cryptocurrencies.
The graph below charts the price of a 2028 Coinbase bond issued with a coupon/yield of 3.375%. The bond is now trading at 54 cents on the dollar, making its yield north of 15%. Accordingly, the bond market is pricing in a decent chance of bankruptcy. While removing FTX as a competitor may be good for Coinbase, evaporating confidence and skepticism in crypto and its infrastructure are weighing on the entire industry.
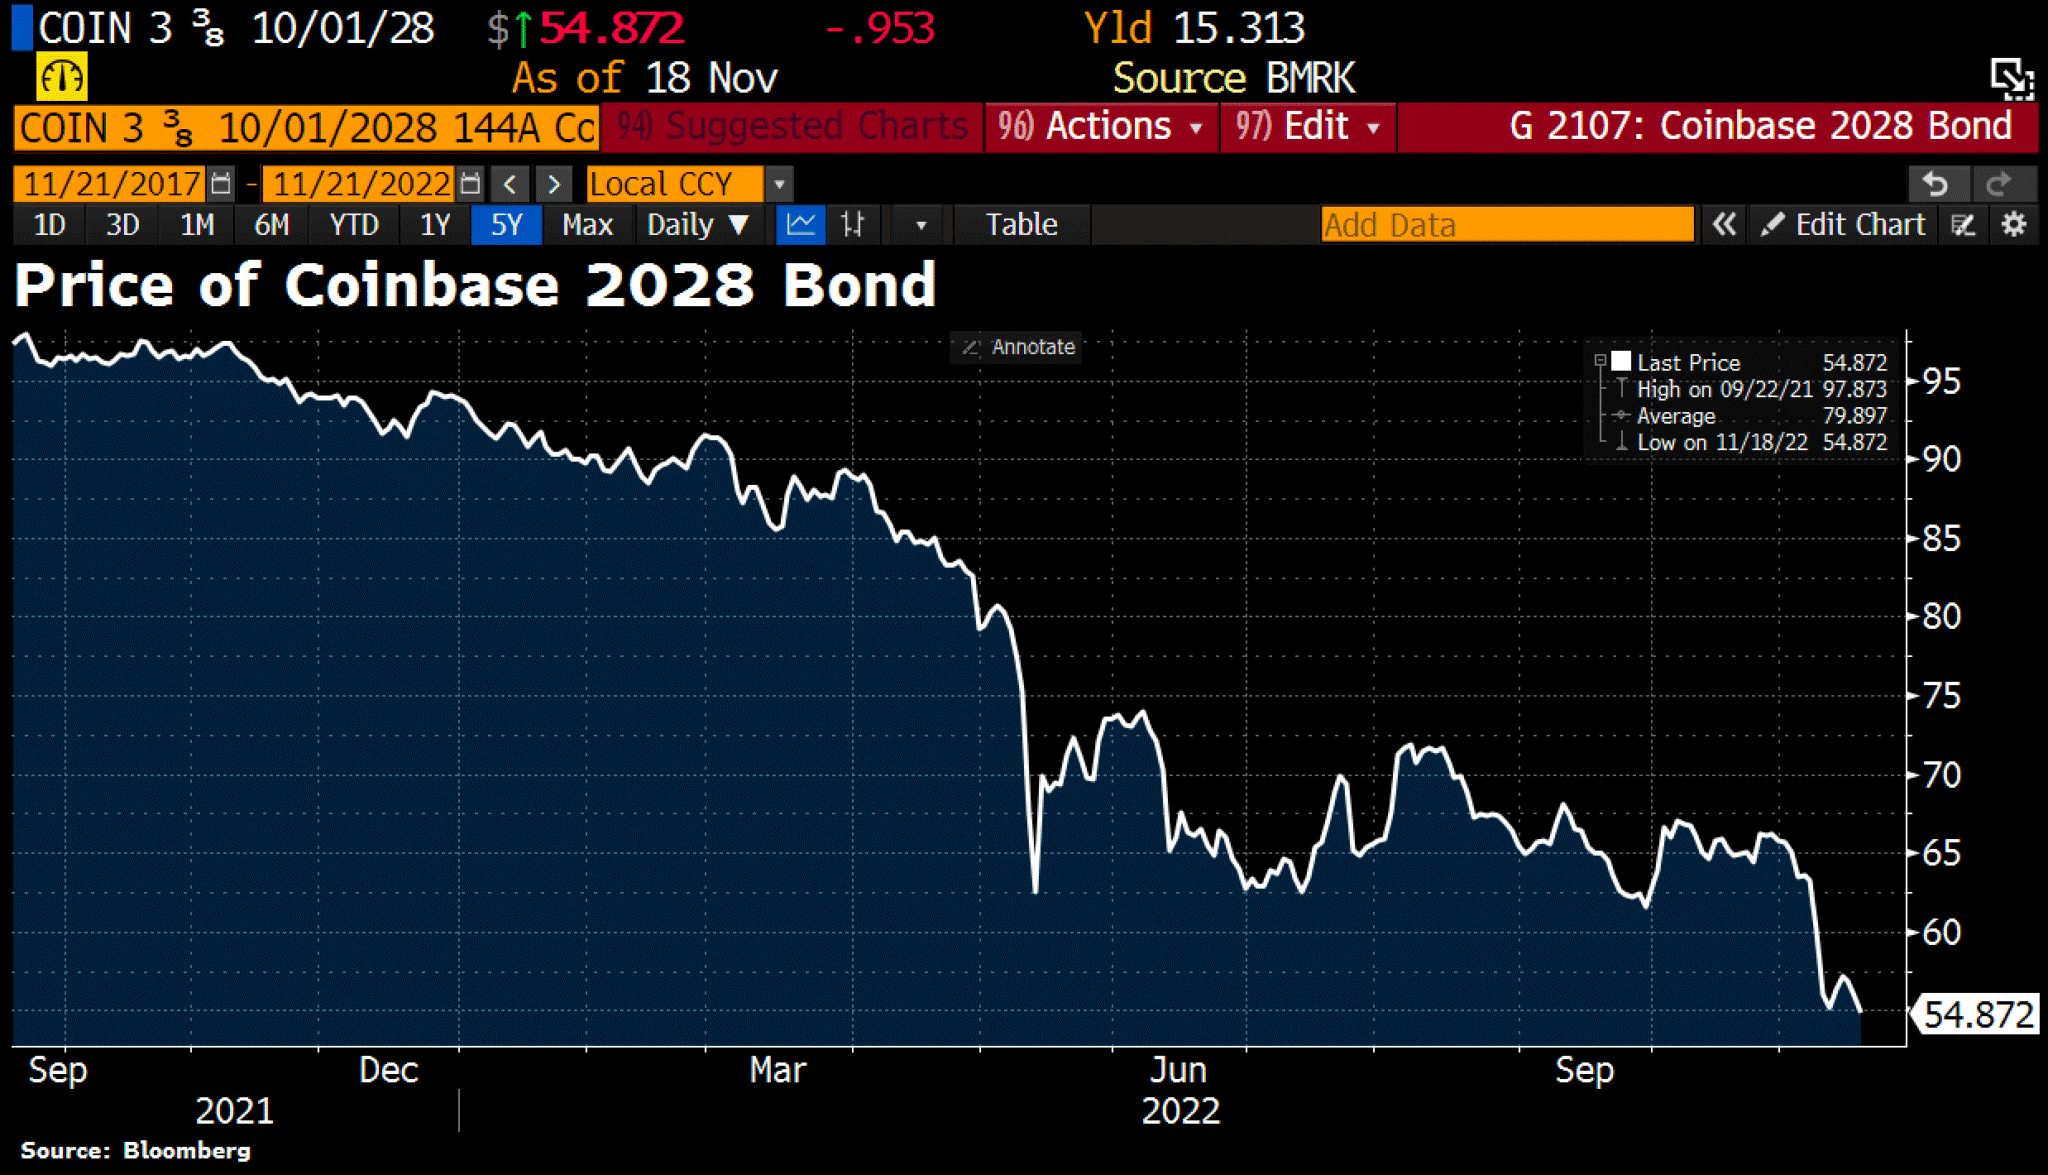
Source: Charlie Bilello, Lance Roberts
That’s all for today.
Blake
Welcome to The Sandbox Daily, a daily curation of relevant research at the intersection of markets, economics, and lifestyle. We are committed to delivering high-quality and timely content to help investors make sense of capital markets.
Blake Millard is the Director of Investments at Sandbox Financial Partners, a Registered Investment Advisor. All opinions expressed here are solely his opinion and do not express or reflect the opinion of Sandbox Financial Partners. This Substack channel is for informational purposes only and should not be construed as investment advice. Clients of Sandbox Financial Partners may maintain positions in the markets, indexes, corporations, and/or securities discussed within The Sandbox Daily.