The Fed pivot, plus energy stocks, labor data, and state-owned investors
The Sandbox Daily (4.4.2023)
Welcome, Sandbox friends.
Today’s Daily discusses:
Fed pivot brings a wide range of possibilities
jolt in energy stocks
fresh batch of labor data
state-owned investors (SOIs) weather the 2022 storm
Jamie Dimon, the Chairman and CEO of JPMorgan Chase & Co., released his annual shareholder letter today. Last year’s “hurricane” economic outlook has been downgraded to “storm clouds ahead.” Outside of Warren Buffett’s annual shareholder letter, no voice carries more weight or significance across markets, so soundbites from today’s letter will reverberate across mainstream financial media for the rest of the week.
Let’s dig in.
Markets in review
EQUITIES: Nasdaq 100 -0.37% | S&P 500 -0.58% | Dow -0.59% | Russell 2000 -1.81%
FIXED INCOME: Barclays Agg Bond +0.37% | High Yield -0.29% | 2yr UST 3.823% | 10yr UST 3.339%
COMMODITIES: Brent Crude +0.27% to $85.16/barrel. Gold +1.93% to $2,039.1/oz.
BITCOIN: +0.63% to $28,261
US DOLLAR INDEX: -0.52% to 101.564
CBOE EQUITY PUT/CALL RATIO: 0.61
VIX: +2.43% to 19.00
Quote of the day
“When one talks about risk for too long, it begins to cloud your judgment.”
-Jamie Dimon
Fed pivot brings a wide range of possibilities
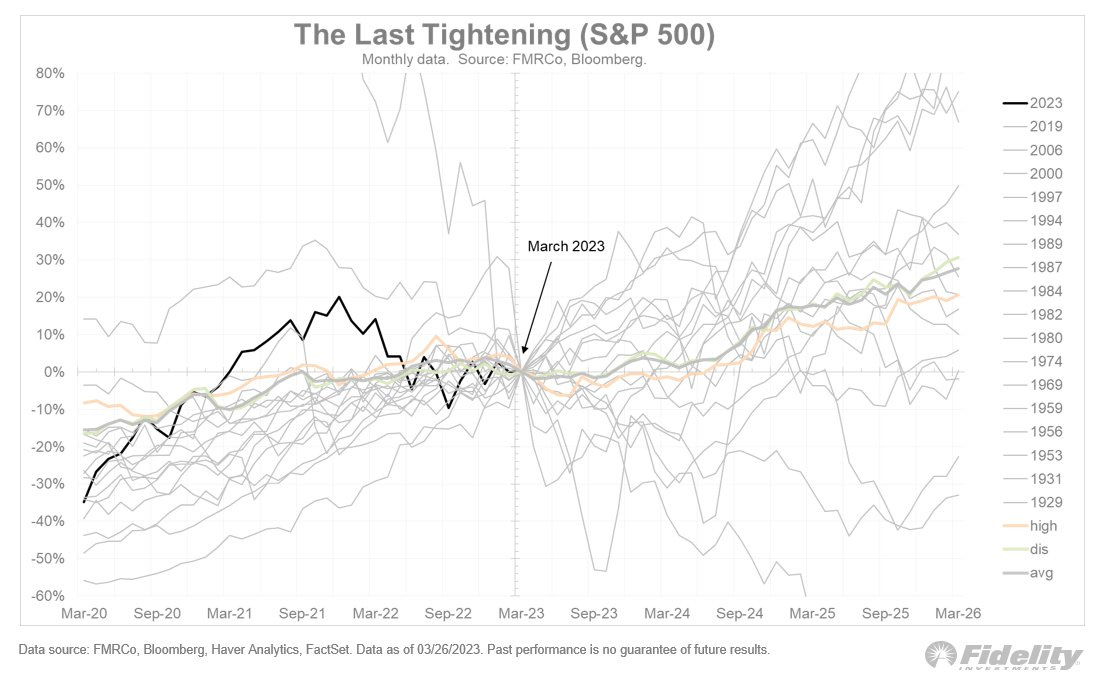
Despite the popular narrative of a Fed pivot = stocks to the moon, and yesterday’s Sandbox Daily discussion of this same signal (which focused on more recent data), the full weight of market history and all Fed tightening cycles since the 1900s shows that anything is possible when the Fed does pivot.
The chart below shows the performance of the S&P 500 over a 3-year period following the last interest rate hike of that respective cycle, with the vertical line in the middle representing the zero line. Lines that move into the upper right quadrant means the S&P 500 was positive three years after the final rate hike; the bottom right quadrant is the opposite, in which markets were lower. While more squiggly lines exist above the 0% horizontal line than below, the chart is like a spider web in which there’s a line everywhere you look. This chart shows there is no predictive power in knowing how markets will perform even if you know the exact timing of the last rate hike.
Context is key here because the surrounding circumstances to each cycle and change in monetary policy are unique to every case, even if some overarching themes are similar. A pivot in policy to easing at the right time can be a major boost for risk assets, but a pivot in policy to easing after a procession of policy mistakes and the prospect of recession/crisis is an entirely different thing.
As Jurrien Timmer and Josh Brown recently discussed on The Compound and Friends podcast: “In terms of market timing, it’s a mess; there is no clear signal. Even if you know perfectly what is going to happen next, you don’t know how much of that is priced or how the market is going to react.”
Source: Jurrien Timmer, Topdown Charts, The Compound and Friends
Jolt in energy stocks
Energy stocks have rallied more than 10% in just over a week. In the middle of March, many strategists were discussing the damage to the structural trends in the energy sector and watching for evidence of further downside.
But, these stocks have reversed course over the past week, shifting from short-term laggards to leaders. With bulls coming out to defend the 2021 highs in brent crude oil near $75 per barrel, now the focus shifts to shorter timeframes to analyze the tactical trends.
The surprise announcement from OPEC on supply cuts boosted energy stocks in a major way, causing the Select Sector SPDR Energy Fund (XLE) to break back above prior lows of its pattern and exceeded the downtrend from early 2023.
And if you draw Fibonacci retracement lines based on the second half of the 2022 rally, we obtain logical levels that coincide with pivot lows. After falling roughly 20%, the energy sector ETF (XLE) appears to have found support at its 61.8% retracement last month. Coming into the new week, we’re seeing bullish follow-through as price gapped higher yesterday, taking out a shelf of recent lows at the 38.2% retracement.
This is a very bullish technical development and should lead XLE back higher to challenge the highs of early 2023 in the low $90’s.
The recent strength from energy stocks is just the latest example of the constructive sector rotation that has been taking place since the October lows of last year.
Source: Fundstrat, All Star Charts
Job openings fell sharply in February
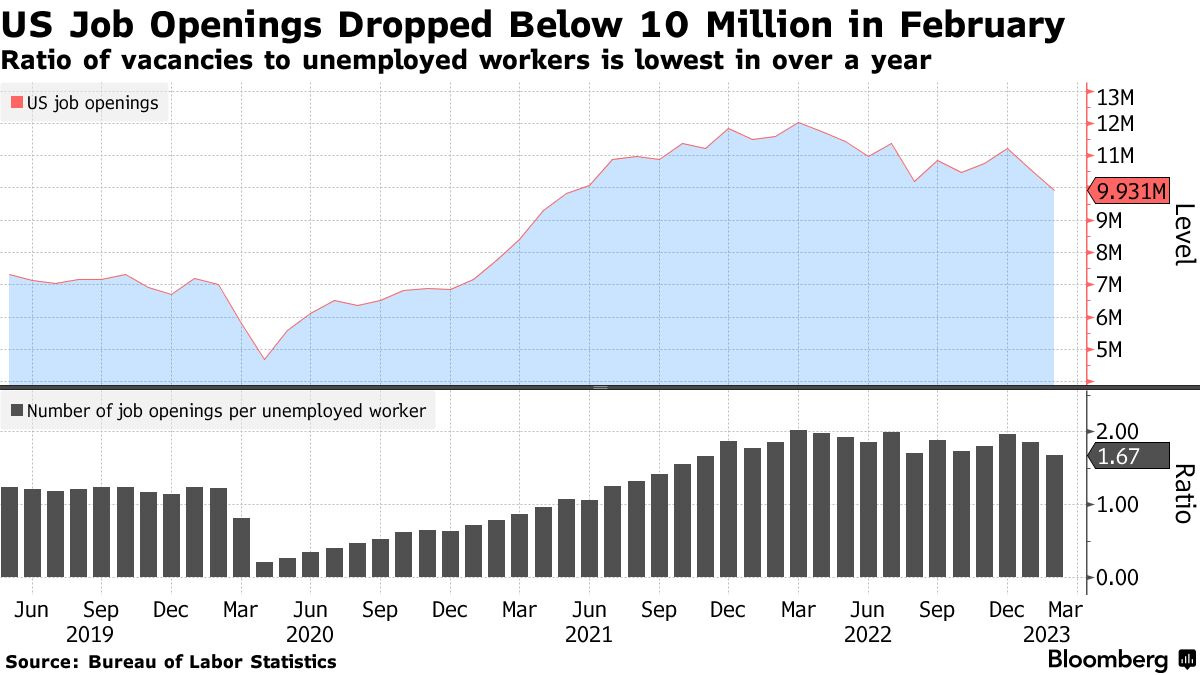
Every month, we turn to the Labor Department's Job Openings and Labor Turnover (JOLTS) survey to understand the ebbs and flows of what's really happening among businesses and their workers.
The number of job openings employers reported dropped by 632,000 in February – falling to 9.9 million open jobs from January’s 10.6 million – reaching the lowest level since May 2021. That's consistent with a story in which employers react to a slowing economy by pulling back on hiring.
The other closely watched metric, the ratio of job openings to unemployed Americans, fell in February to 1.67 and is firmly off the cycle peak of 1.99, but it remains in the same historically high range it has been in since late 2021. Normal is considered 1.0 to 1.2.
On the flip side, the very same report showed that hiring remained steady, and the number of people laid off or discharged from their jobs fell. Meanwhile, voluntary quits actually rose. None of those are what you expect to see in a labor market slump. Normally, downturns cause companies to slow hiring dramatically, fire workers, and prompt those remaining to hold onto their jobs for dear life.
Source: Ned Davis Research, Bureau of Labor Statistics, Bloomberg, CNBC
State-owned investors (SOIs) weather the 2022 storm
The consulting firm Global SWF tracks a variety of metrics about Sovereign Wealth Funds (SWFs) and Public Pension Funds (PPFs) from across the world.
Global SWF’s recent annual report shows the collective assets under management (AUM) for 2022 year-end was an estimated value of $31.4 trillion, down only slightly from the peak value of $33.6 trillion in 2021.
2022 was notable in that it was the first and only year where these values decreased, although the surprising element is how little asset values dropped given the simultaneous and significant correction in both stocks and bonds.
The size of these asset pools is breathtaking.
The asset class of the year was hedge funds, where both SWFs and PPFs increased their allocation due to the simultaneous fall of both stocks and bonds and the needs to find diversification and uncorrelated strategies.
Indonesia was chosen as the region of the year due to the country’s ongoing transformation and strong prospects.
Infrastructure was selected as the industry of the year due to their long-term predictable cash flows, a residual value, and alignment with sovereign investors.
Source: Global SWF
That’s all for today.
Blake
Welcome to The Sandbox Daily, a daily curation of relevant research at the intersection of markets, economics, and lifestyle. We are committed to delivering high-quality and timely content to help investors make sense of capital markets.
Blake Millard is the Director of Investments at Sandbox Financial Partners, a Registered Investment Advisor. All opinions expressed here are solely his opinion and do not express or reflect the opinion of Sandbox Financial Partners. This Substack channel is for informational purposes only and should not be construed as investment advice. Clients of Sandbox Financial Partners may maintain positions in the markets, indexes, corporations, and/or securities discussed within The Sandbox Daily.


