

The market is heading higher 🙂 but stocks are moving lower ☹️ ??!?!
The Sandbox Daily (12.17.2024)

Welcome, Sandbox friends.
Today’s Daily discusses:
breadth woes continue
data center growth bolstering today’s infrastructure
investor expectations for the second Trump administration
Let’s dig in.
Blake
Markets in review
EQUITIES: S&P 500 -0.39% | Nasdaq 100 -0.43% | Dow -0.61% | Russell 2000 -1.18%
FIXED INCOME: Barclays Agg Bond 0.00% | High Yield -0.21% | 2yr UST 4.247% | 10yr UST 4.395%
COMMODITIES: Brent Crude -0.74% to $73.36/barrel. Gold -0.30% to $2,661.9/oz.
BITCOIN: +0.02% to $106,307
US DOLLAR INDEX: +0.09% to 106.952
CBOE TOTAL PUT/CALL RATIO: 0.85
VIX: +8.03% to 15.87
Quote of the day
“It is during our darkest moments that we must focus to see the light.”
- Aristotle
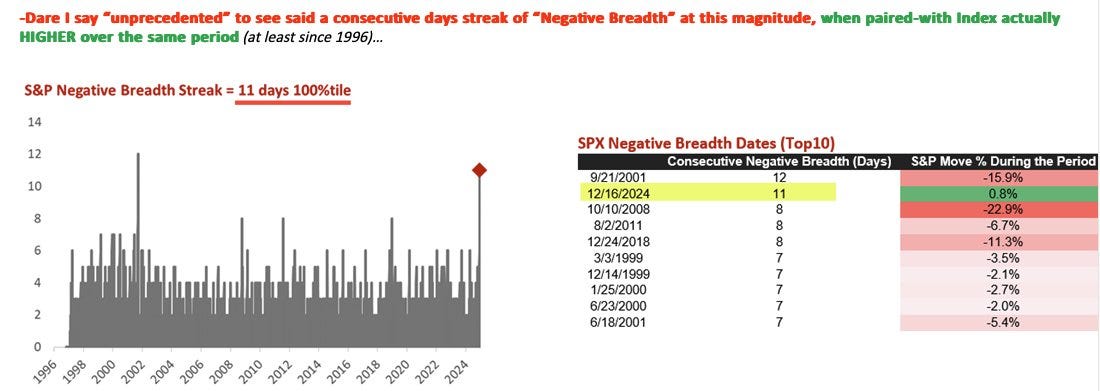
Breadth woes continue
Yesterday was 11, today it’s 12.
12 consecutive days of more stocks Declining than Advancing for the S&P 500 index.

The S&P 500 is undergoing one of the largest periods of consecutive negative breadth over the past 20 years, as the latest reading of more Declining to Advancing issues brings this number to 12, matching the unceremonious streak back from 2001.
Interestingly enough, this current episode is the only instance in which the index has remained positive during the breadth divergence. Large-cap tech is carrying the torch on its own into year-end.
This swing in market breadth is showing up on charts everywhere.
On November 29, 84% of SPX constituents were above their 20-day moving average. As of yesterday, that share is down to 26%.
Short-dated time frames – like the 20 DMA – are often full of noise and false signals, but trends always start somewhere and these short-dated windows do present the first whiff of turning points in the market.

The last time we saw material breadth erosion in the broader market – even as the index continued to march toward new highs – was at the peak back in 2021.
Here we are looking at the weakness creeping into the longer-term moving averages. Price (white line) is moving higher, while breadth (red line) is not confirming.

So, what does it all mean?
Markets remain quite choppy as the S&P 500 is largely range-bound in December (within an ongoing bullish uptrend for the better part of two years).
In the short run, the broader averages have largely avoided a major downturn due to the resurgence and outsized strength emanating from the Magnificent 7 and adjacent names/areas.
Should big tech falter, the averages will stumble.
Should the various sectors that are at/near oversold conditions catch a bid, the market should stabilize and push higher into year-end.
With the holiday season upon us, investors are hoping for this consolidation to resolve higher in the same direction as the underlying primary trend.
Source: Nomura, ZeroHedge, Bloomberg
Data center growth bolstering today’s infrastructure
The growth of data centers in the United States is driven by an increasing demand for cloud compute, digital services, and data storage – all fueled by corporate budgets spanning hundreds of industry. Advancements in artificial intelligence, the expansion of 5G networks, and the need for high-performance computing are further accelerating the demand for robust data infrastructure.
The Electric Power Research Institute (EPRI) estimates that 70% of global internet traffic funnels through Virginia, particularly Northern Virginia, which has emerged as the global epicenter for data centers. Roughly 300 facilities are located across this small geographic region.
Overall construction of data centers is up more than sevenfold in just two years according to commercial property giant JLL.
The surge in data center infrastructure in the United States is unmatched versus the global stage.

Building data centers is one thing, powering them is another.
It is too early to know just how much power data centers will need. Estimates range from around 4% of power consumed last year in the U.S. to something between 4.6% and 9.1% by 2030 depending on growth scenarios, according to the EPRI.
Source: Torsten Slok, Electric Power Research Institute (EPRI), Wall Street Journal
Investor expectations for the second Trump administration
The market is trying to understand policy changes under the upcoming Trump administration across three key areas: immigration, fiscal policy, and tariffs.
On immigration, tighter policy could lower net immigration to 750K per year, moderately below the pre-pandemic average of 1M per years.
On fiscal policy, many expect full extension of the expiring 2017 tax cuts and modest additional cuts around the fringes.
On tariffs, the increasingly hostile rhetoric is targeting multiple sovereign nations that have far-reaching consequences. It is this economic policy that creates the wide funnel of potential outcomes in the years to come, which should invite increased volatility across asset classes as market pricing and investor expectations rarely align perfectly with one another.
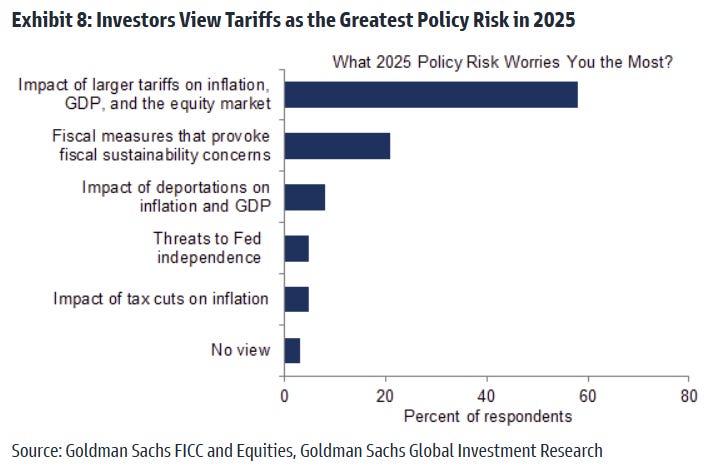
In fact, Goldman ran a survey across 500 of its institutional clients and it is tariffs that concerns investors the most. Roughly 60% of respondents feel tariffs are the greatest policy risk in 2025, followed next by concerns over the nation’s increasing debt load.
Source: Goldman Sachs Global Investment Research
That’s all for today.
Blake
Questions about your financial goals or future?
Connect with a Sandbox financial advisor – our team is here to support you every step of the way!
Welcome to The Sandbox Daily, a daily curation of relevant research at the intersection of markets, economics, and lifestyle. We are committed to delivering high-quality and timely content to help investors make sense of capital markets.
Blake Millard is the Director of Investments at Sandbox Financial Partners, a Registered Investment Advisor. All opinions expressed here are solely his opinion and do not express or reflect the opinion of Sandbox Financial Partners. This Substack channel is for informational purposes only and should not be construed as investment advice. The information and opinions provided within should not be taken as specific advice on the merits of any investment decision by the reader. Investors should conduct their own due diligence regarding the prospects of any security discussed herein based on such investors’ own review of publicly available information. Clients of Sandbox Financial Partners may maintain positions in the markets, indexes, corporations, and/or securities discussed within The Sandbox Daily. Any projections, market outlooks, or estimates stated here are forward looking statements and are inherently unreliable; they are based upon certain assumptions and should not be construed to be indicative of the actual events that will occur.
Please see additional disclosures at the Sandbox Financial Partners website: