

The most important chart for investors, plus financials and small caps at key support, breadth, equity outflows, and the debt limit
The Sandbox Daily (4.19.2023)

Welcome, Sandbox friends.
Today’s Daily discusses:
the most important chart for investors
key polarity levels for two important market segments
market breadth waning
equity market outflows
U.S. debt limit deadline
Let’s dig in.
Markets in review
EQUITIES: Russell 2000 +0.22% | S&P 500 -0.01% | Nasdaq 100 -0.02% | Dow -0.23%
FIXED INCOME: Barclays Agg Bond -0.15% | High Yield -0.40% | 2yr UST 4.248% | 10yr UST 3.591%
COMMODITIES: Brent Crude -2.18% to $82.91/barrel. Gold -0.62% to $2,007.2/oz.
BITCOIN: -4.06% to $29,209
US DOLLAR INDEX: +0.20% to 101.949
CBOE EQUITY PUT/CALL RATIO: 0.64
VIX: -2.20% to 16.46
Quote of the day
“The main thing is to keep the main thing the main thing.”
- Stephen Covey, The 7 Habits of Highly Effective People
The most important chart for investors
As investors in stocks, volatility is the toll you pay to achieve long-term capital appreciation.
Sometimes the ride isn’t always the easiest, but that patience to endure difficult markets allows investors to avoid making costly mistakes at the worst time.
Setting the right expectations when investing in public equities is critically important to your success. In that vein, here is what you should expect on average from the S&P 500:
each year sees more than 7 different 3% dips
stocks correct 5% more than 3 times a year do
about once a year on average sees a 10% correction
a 15% major correction happens every year-and-a-half
20% bear markets happen about every three years
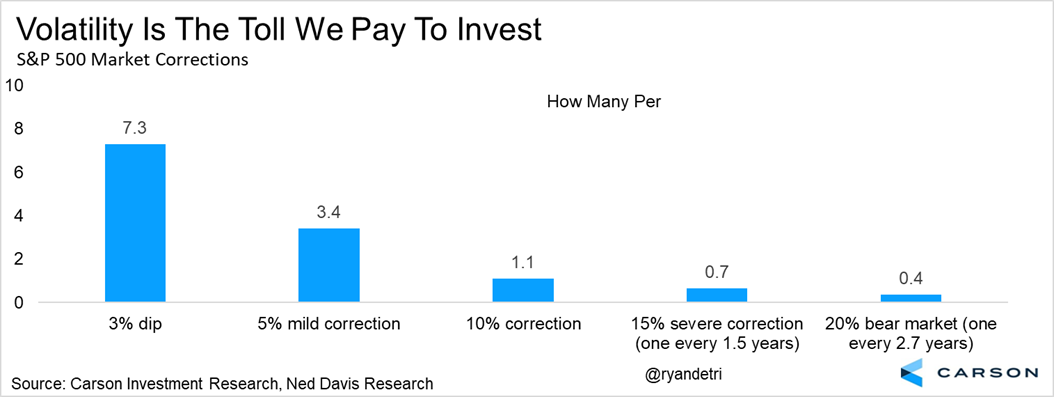
Do yourself a favor and save this chart for perpetuity. When the next market drawdown comes, you will be mentally ready for it.
Source: Carson Investment Research
Key polarity levels for two important market segments
The importance of prior-cycle highs in major indices and sectors must be respected because of the price memory that buyers and sellers demonstrate at those respective levels over time.
The Russell 2000 ETF (IWM) and the Financial Sector ETF (XLF) are two examples of critical market segments that are bouncing around those key levels:
Prices bounced off a shelf of former resistance at the current level for the third time as buyers successfully defended the 2018 and 2020 highs.
If these index funds are above their former highs, then the structural trends likely remain intact. However, a violation of these levels could warrant a more cautious outlook toward the broader market and risk assets in general.
Source: All Star Charts
Market breadth waning
Healthy markets are broader markets, but so far this year’s market is extraordinarily narrow.
Despite the S&P 500 index currently being at higher levels than it was back in November/December 2022, S&P 500 breadth has been steadily deteriorating.
Only ~55% of SPX constituents are currently above their 50-day moving average, compared to +90% five months ago.

What’s more, the percentage of stocks within the index outperforming the S&P 500 basket itself on a three-month rolling basis is the lowest on record.

Most of the technical damage was incurred back in later February and much of March, which is now being recouped in many groups – led by Financials, Consumer Discretionary, Industrials, HealthCare. Much of the leadership this year has come from Tech and tech-adjacent names, so perhaps sector rotation is just what the market needs to sustain the current rally.
Source: Liz Ann Sonders, Morgan Stanley
Equity market outflows
Investors have withdrawn from U.S. equity mutual funds and exchange-traded funds in 11 of the year’s first 15 weeks.

Source: Bloomberg
Checking in on the debt limit
While the data are still very preliminary, weak tax collections so far in April suggest an increased probability that the debt limit deadline will be reached in the first half of June as the Treasury exhausts its cash and borrowing capacity, which contrasts to reporting earlier this year that projected the Treasury could operate without a debt limit increase until early August.
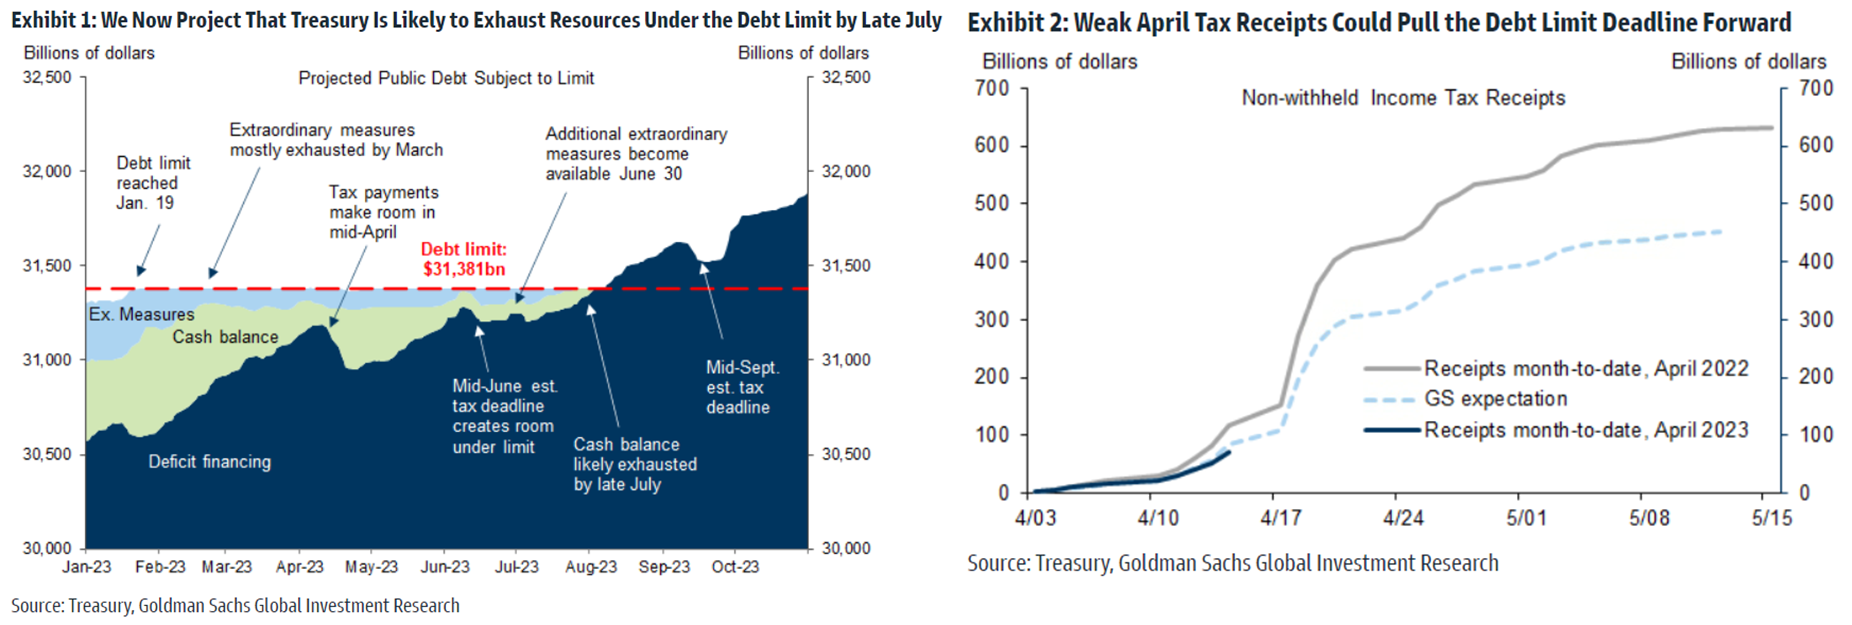
So far, financial markets do not appear to reflect debt limit risks with the exception of sovereign CDS spreads, which have widened considerably. As the debt limit deadline comes into better focus with additional tax receipt data, expect to see firmer pricing of debt limit risks in financial markets. That said, the possibility of a short-term extension – particularly if the deadline falls in early June – might reduce the degree to which market participants engage on the issue.

The recent Fund Managers Survey from Bank of America confirms this complacency in markets. The responses show the U.S. Treasury debt downgrade a distant 4th in respect to the most likely source of an upcoming credit event.

Source: Goldman Sachs Global Investment Research, The Daily Shot
That’s all for today.
Blake
Welcome to The Sandbox Daily, a daily curation of relevant research at the intersection of markets, economics, and lifestyle. We are committed to delivering high-quality and timely content to help investors make sense of capital markets.
Blake Millard is the Director of Investments at Sandbox Financial Partners, a Registered Investment Advisor. All opinions expressed here are solely his opinion and do not express or reflect the opinion of Sandbox Financial Partners. This Substack channel is for informational purposes only and should not be construed as investment advice. Clients of Sandbox Financial Partners may maintain positions in the markets, indexes, corporations, and/or securities discussed within The Sandbox Daily.
So important to set expectations when investing in stocks and no measure is more important than volatility!