The most important themes and charts that defined 2023 (part I)
The Sandbox Daily (12.11.2023)
Welcome, Sandbox friends.
As the curtain descends on 2023, it’s always a fruitful exercise to take stock on the year that was and review important themes, lessons learned, and dissect those crucial moments where reality and expectations were incongruent with one another.
While it may not feel like it, investors truly do have much to be thankful for this holiday season. Over the past year, investors have navigated both short-term challenges due to interest rate swings, the banking crisis, and ongoing political battles in Washington D.C., as well as long-term uncertainty resulting from inflation, the Fed, geopolitical conflicts, and a myriad of other risks. And yet, through all of this, major market indices have climbed the wall of worry and held onto strong gains, reversing much of last year's declines.
Financial markets and the economy defied expectations in 2023, proving many market technicians right and countless economists wrong. In many ways, the current environment represents the best-case scenario for which we all could have hoped just a year ago. With only a few weeks left in the year, the S&P 500 has returned +20.4%, the QQQs +48.3%, and the Dow +9.8%. Interest rates climbed throughout the year but have retreated in recent weeks. These results are far better than last year's historic bear market decline.
Over the course of this week, we will review the most important themes and charts that defined 2023.
Today’s Daily discusses:
the Magnificent 7 dazzles investors
classic recession indicator remains in place
VIX the key to unlocking markets
staggering losses over in bond land
Let’s dig in.
Markets in review
EQUITIES: Nasdaq 100 +0.85% | Dow +0.43% | S&P 500 +0.39% | Russell 2000 +0.15%
FIXED INCOME: Barclays Agg Bond +0.01% | High Yield -0.07% | 2yr UST 4.712% | 10yr UST 4.239%
COMMODITIES: Brent Crude +0.34% to $76.09/barrel. Gold -0.86% to $1,997.2/oz.
BITCOIN: -6.34% to $41,160
US DOLLAR INDEX: +0.07% to 104.078
CBOE EQUITY PUT/CALL RATIO: 0.56
VIX: +2.27% to 12.63
Quote of the day
“It is remarkable how much long-term advantage people like us have gotten by trying to be consistently not stupid, instead of trying to be very intelligent. There must be some wisdom in the folk saying: ‘It’s the strong swimmers who drown.’”
- Charlie Munger
The Magnificent 7 dazzles investors
Narrow leadership has been one of the most consistent and compelling headlines for the stock market in 2023.
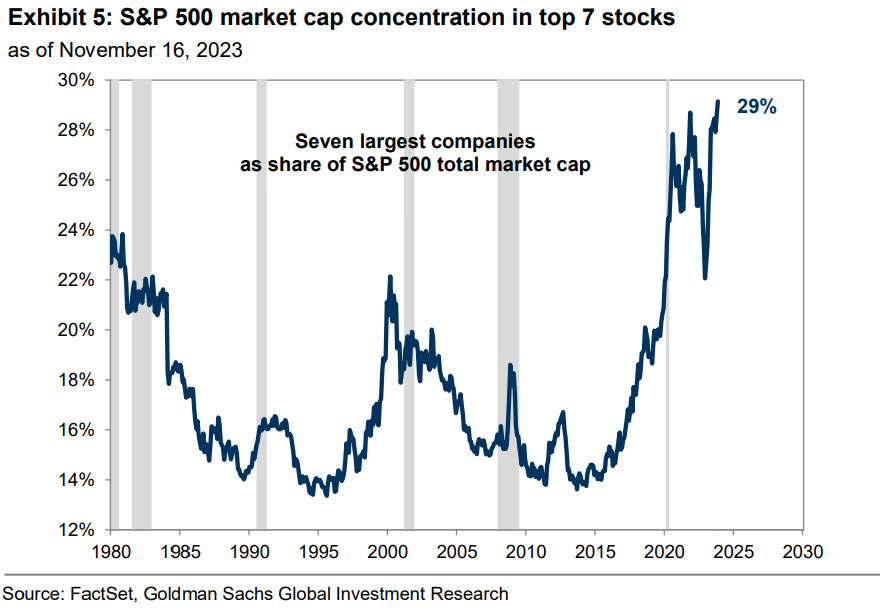
The outperformance of “The Magnificent Seven,” sometimes referred to as the “S&P 7,” is truly something to behold.
The S&P7 – comprised of Apple (AAPL), Amazon.com (AMZN), Alphabet (GOOG, GOOGL), Meta Platforms (META), Microsoft (MSFT), NVIDIA (NVDA), and Tesla (TSLA) – are up a staggering +70.2% through the first 11 months of the year as a group. Meanwhile, the remaining “S&P 493” is only +5.0% higher and was actually negative at various times throughout the year.
The Magnificent 7 now accounts for 29% of the entire market capitalization for the S&P 500 index.
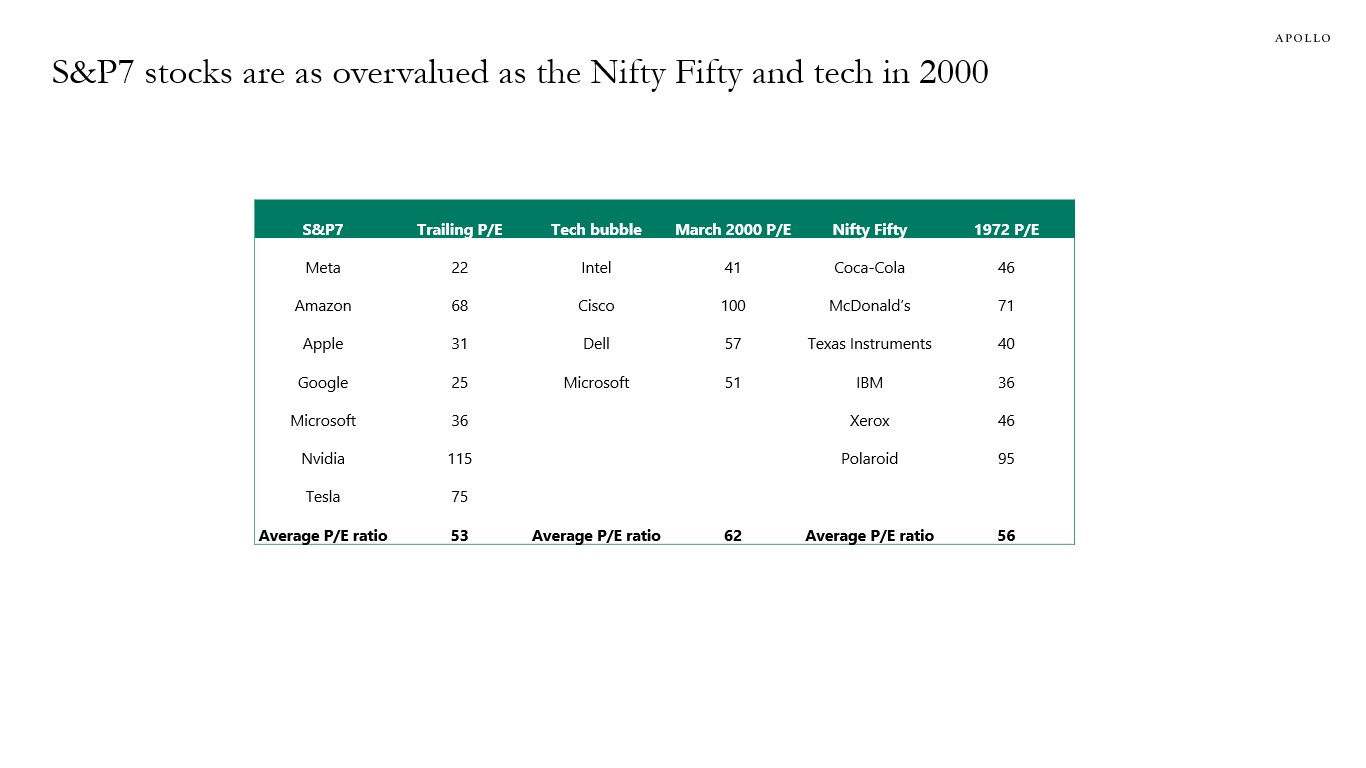
Rising valuations for these tech giants has led some investors to raise a red flag.
Here, Torsten Slok, Apollo’s Chief Economist, notes the S&P7 valuations are beginning to look similar to the Nifty Fifty and Tech Bubble of 2000.
Source: YCharts, The Sandbox Daily, Torsten Slok, Richard Bernstein Advisors, Goldman Sachs Global Investment Research
Classic recession indicator remains in place
Several indicators get highlighted in financial media for which the market closely watches to gauge the risk of recession. The signal from an inverted yield curve – where long-term lending rates are below short-term borrowing rates – is one to which I always assign great value.
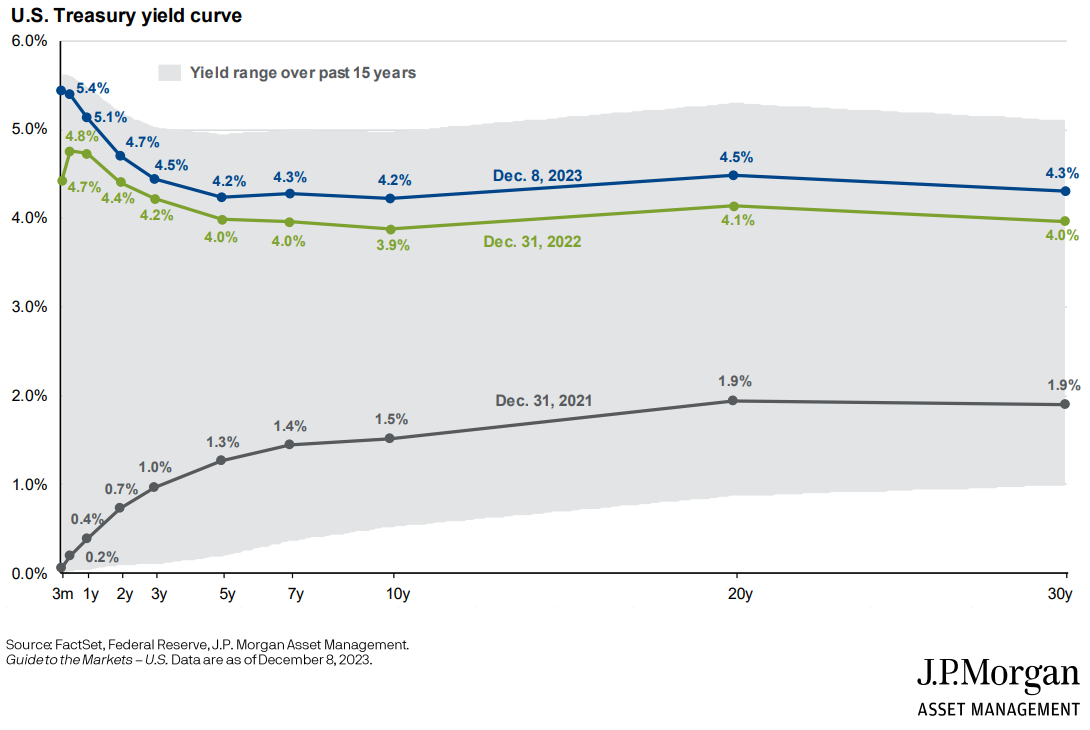
Below is the U.S. Treasury yield curve from the last three years that shows the evolution of the current monetary policy cycle, as well as the broader range of interest rates over the last 15 years (grey shade block).
The current yield curve remains inverted (blue line), a stark departure from the normal upward-sloping yield curve we normally see (example, 2021’s grey line).
The 10-year/2-year portion of the curve has the best track record in predicting business and economic cycles. Over the past 50 years, the curve has inverted 6 times and 6 recessions followed – this signal never generated a false positive (red bubbles below).
Meanwhile, the Federal Reserve has often stated they track the 10-year/3-month spread, a similar indicator with a compelling track record.
Both measures remain firmly inverted.
The 10-year/3-month yield curve has now been inverted for a record 272 trading days (top pane), while the 10-year/2-year curve has been inverted for 360 straight trading days (bottom pane), the 2nd longest streak on record.
These streaks have always been associated with recessions.
Eventually, this classic indicator may get it right. Or maybe it won’t. Use history as a guide, not gospel.
Source: J.P. Morgan Guide to the Markets, YCharts, Bloomberg, Bespoke Investment Group
VIX the key to unlocking markets
Equity markets have been very calm this year after a volatile and frustrating 2022.
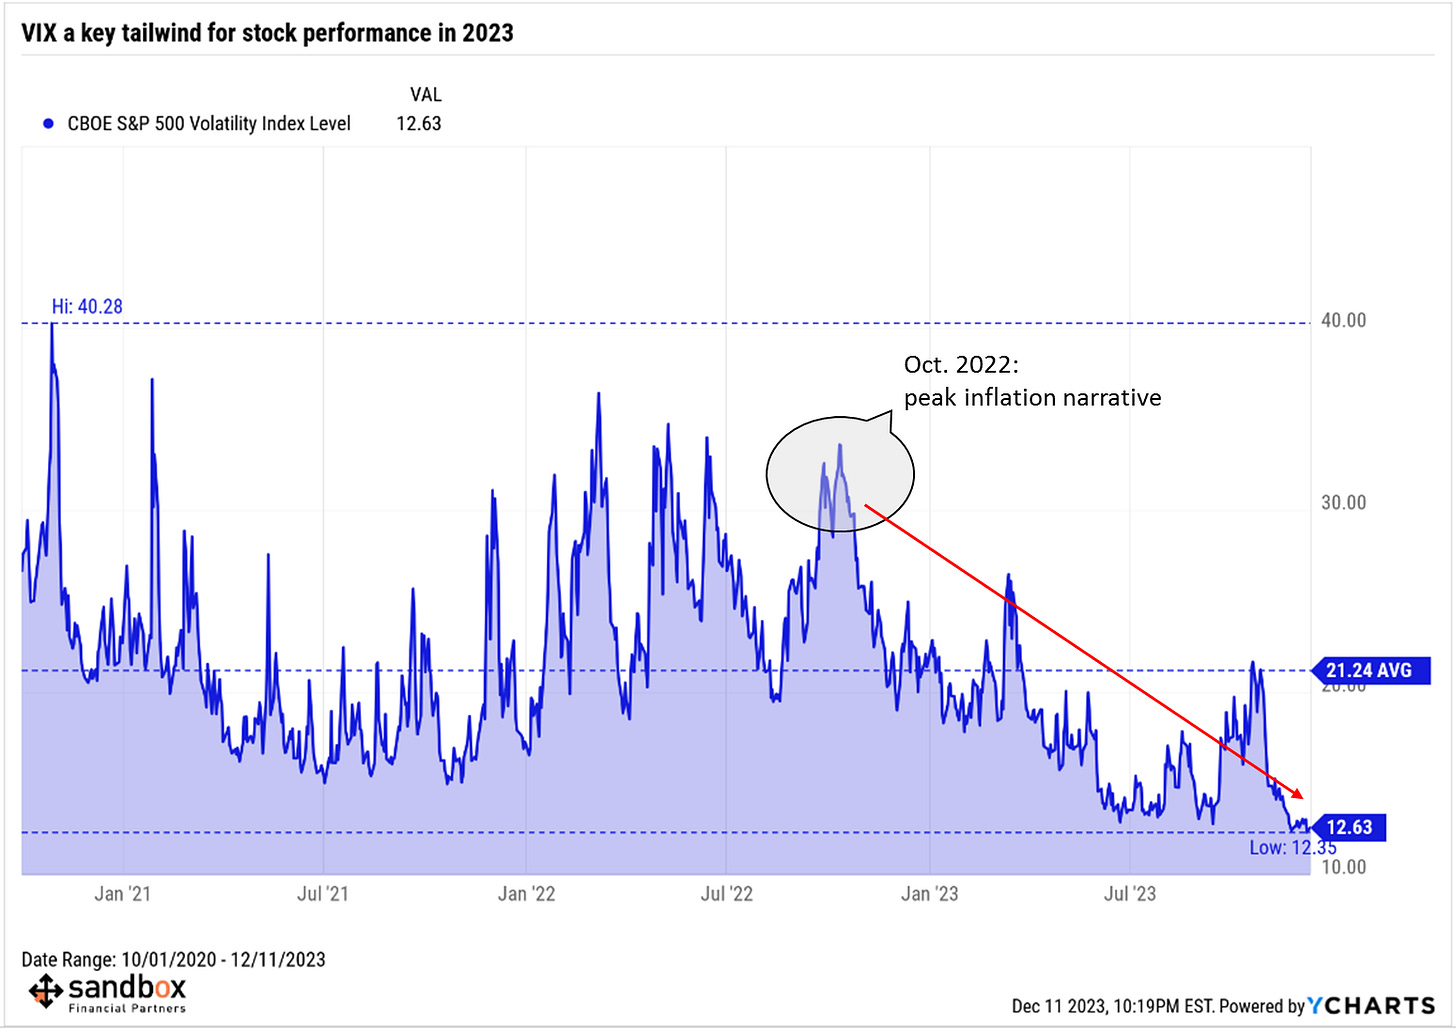
The CBOE Market Volatility Index, or VIX, is at its lowest levels in years. Let’s unpack how we got here.
The inflation narrative dominated headlines in 2022, peaking sometime around October. And when inflation began to “hit a wall” in October, so did equity volatility.
Refreshing our memory banks a little bit, October 13th, 2022 is when we received the jumbo-sized +0.6% MoM core inflation reading, causing the S&P 500 to gap down pre-market over -2% to only end the day positive (+2.6%, in fact) on the back of a fierce intra-day rally.
Market technicians call this a “bullish engulfing candle” – they love these signals because they often signify trend reversal. This marked the stock bottom.
Ever since, the collapse in VIX has been impressive, especially when weighed against the incredibly uncertain macro backdrop and tightening of financial conditions.
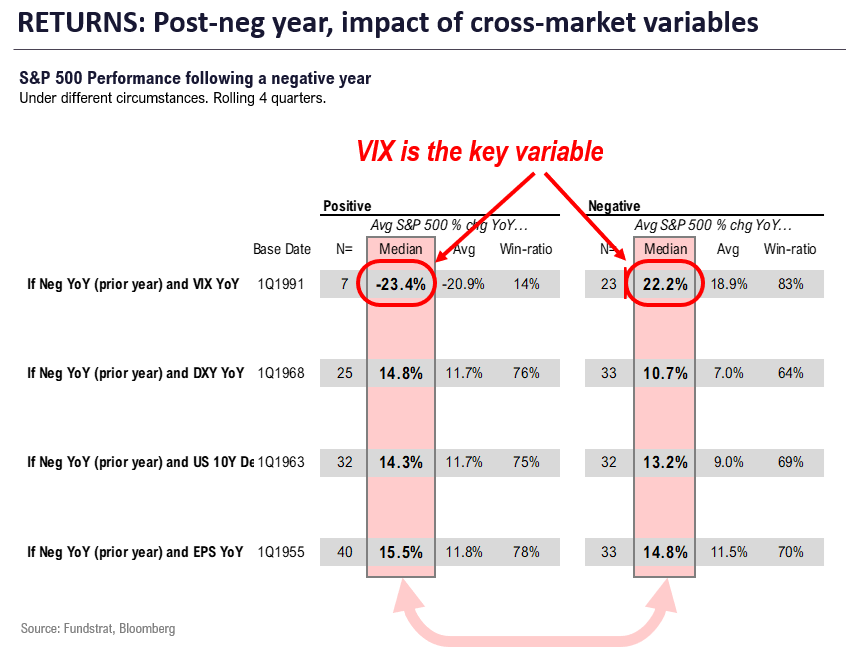
And, most importantly, falling volatility is generally a good thing for asset prices.
In fact, after a negative return year (like 2022), the median equity gain the next year is +22% (sample size of 23, win ratio=83%) when the VIX is falling, versus equity losses with a median -23% return when the VIX continues rising.
As the scatter plot below highlights, we can see the sizable influence of the VIX.
Even in “All Years,” the bifurcation in outcomes shows VIX is a key differentiating input in realized returns.
Source: YCharts, FS Insight
Staggering losses over in bond land
At one point this fall, long duration U.S. Treasury Bonds had lost more in percentage terms than stocks did during the Global Financial Crisis (GFC) in 2008-2009.
At its absolute low on October 19th, the drawdown in the Vanguard Extended Duration Treasury ETF (-64.48%) comfortably exceeded the peak-to-trough losses suffered in the S&P 500 during the GFC crash (-56.0%).
The selloff in bonds also took twice as long, so the suffering has been painful across both time and value.
Source: Callum Thomas
That’s all for today.
Blake
Welcome to The Sandbox Daily, a daily curation of relevant research at the intersection of markets, economics, and lifestyle. We are committed to delivering high-quality and timely content to help investors make sense of capital markets.
Blake Millard is the Director of Investments at Sandbox Financial Partners, a Registered Investment Advisor. All opinions expressed here are solely his opinion and do not express or reflect the opinion of Sandbox Financial Partners. This Substack channel is for informational purposes only and should not be construed as investment advice. The information and opinions provided within should not be taken as specific advice on the merits of any investment decision by the reader. Investors should conduct their own due diligence regarding the prospects of any security discussed herein based on such investors’ own review of publicly available information. Clients of Sandbox Financial Partners may maintain positions in the markets, indexes, corporations, and/or securities discussed within The Sandbox Daily. Any projections, market outlooks, or estimates stated here are forward looking statements and are inherently unreliable; they are based upon certain assumptions and should not be construed to be indicative of the actual events that will occur.


