The most important themes and charts that defined 2023 (part II)
The Sandbox Daily (12.12.2023)
Welcome, Sandbox friends.
Today’s Daily discusses:
money market funds enter the public lexicon
Americans’ net worth surged by record 37% from 2019-2022
bonds watching the sun rise over the horizon, finally
residential housing market remains in flux
Let’s dig in.
Markets in review
EQUITIES: Nasdaq 100 +0.82% | Dow +0.48% | S&P 500 +0.46% | Russell 2000 -0.13%
FIXED INCOME: Barclays Agg Bond +0.30% | High Yield +0.22% | 2yr UST 4.733% | 10yr UST 4.204%
COMMODITIES: Brent Crude -3.34% to $73.49/barrel. Gold +0.07% to $1,995.1/oz.
BITCOIN: -0.24% to $41,072
US DOLLAR INDEX: -0.27% to 103.817
CBOE EQUITY PUT/CALL RATIO: 0.53
VIX: -4.43% to 12.07
Quote of the day
“Technical Analysis is the study of the behavior of the market, and therefore market participants. We’re analyzing how humans behave. That’s the edge that a good technician has over other types of investors. Conditions change. Market environments go through different cycles. But the humans act in similar ways.”
- J.C. Parets, Founder & CEO of All Star Charts in What Does The Santa Claus Rally Mean in 2023?
Money market funds enter the public lexicon in 2023
Money markets regained their mojo in 2023 as investors feared calls of recession and an uncertain stock market outlook.
Offering roughly 5% yield and safety of principal, money market funds were a significant beneficiary to large swaths of dry powder sitting in savings accounts all across America earning effectively 0% interest.
Money market fund assets just rose to a fresh all-time high, up to $5.898 trillion in total assets – nearly a double from early 2019.
Source: Bloomberg
Americans’ net worth surged by record 37% from 2019-2022
The Federal Reserve released their triennial Survey of Consumer Finances report in October, a report conducted every three years and one of the primary sources of information on the financial condition of U.S. households. The data was collected from surveys between March and December 2022.
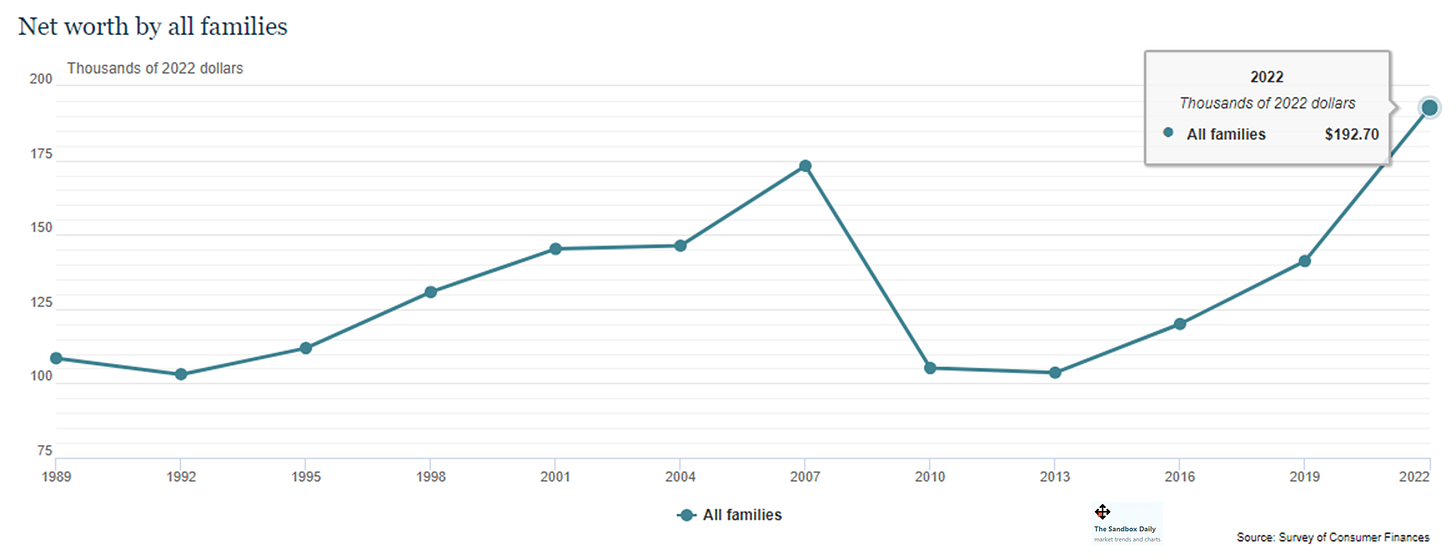
The median, inflation-adjusted net worth for the typical U.S. household grew 37% to $192,700 from 2019 to 2022, the highest on record – fueled by higher home prices, investment account balances, and pandemic-era stimulus payments.
Per Ben Carlson, CFA, the change during 2019-2022 is the biggest increase over a 3-year period in the history of the data set!
And, unlike many events, regulations, and systems that (fairly or unfairly) disproportionately help wealthier households, it is actually the families at the lowest quartile of wealth that have experienced the largest gains in median real net worth post-pandemic. This is good news.
In fact, a recent article from The Economist discusses how strength in the labor market resulting from the pandemic had the unintended outcome of causing a reduction in income inequality, which directly impacts net worth today and for years to come. This is even more good news.
Meanwhile, the percentage share of American households that own stock either in mutual funds, retirement accounts, or as individual shares hit a new high at 58% in 2022 – greater than the previous high-water marks of 53% during the dot-com boom and pre-Global Financial Crisis.
Yup, you guessed it. More good news.
And yet, somehow consumer sentiment remains depressed despite the material gains in household wealth and stock ownership over the last few years, which remains perplexing.
Maybe its from rising geopolitical tensions and culture wars with two major conflicts existing concurrently. Or it’s the lack of affordable housing. Multi-decade highs in inflation sure haven’t helped. Perhaps its lingering uneasiness from COVID, the lockdowns, and the general upheaval that the coronavirus caused. Whatever it is, people are generally in a better place financially even if they don’t feel like it.
Source: Federal Reserve, Survey of Consumer Finances, Sonu Varghese, Barron’s, Axios, Ben Carlson
Bonds seeing the sun rise over the horizon
After some long nights, perhaps the sun is finally rising for bond investors.
Bonds have had a tough go of it – that’s what happens when central banks are hiking rates at the fastest and highest clip in decades, maybe ever (depending on geographic region).
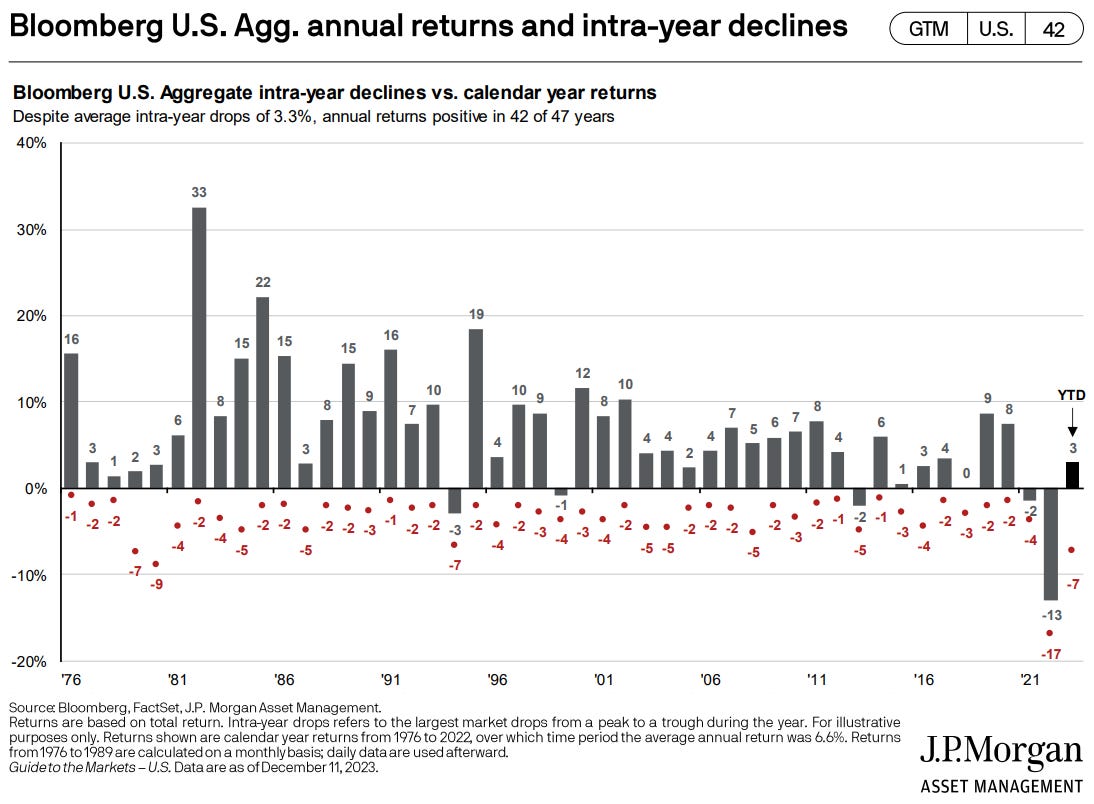
Before 2022, the worst bond rout in the history of the Bloomberg U.S. Aggregate Bond index was -3%. Last year, bonds were on the receiving end of a Mike Tyson uppercut, returning -13%.
Up until 2021-2022, bonds had never endured back-to-back calendar year losses. Well, that changed too.
This year, bonds are looking to reverse course and eke out a small positive total return.
Source: J.P. Morgan Guide to the Markets
Residential housing market remains in flux
The residential housing market exists in a state of flux amidst soaring mortgage rates, a high share of housing stock locked into low fixed-rate loans, tighter lending standards and availability of credit, and chronic undersupply.
The concentration of borrowers locked into low fixed-rate mortgages have blunted the impact of higher rates, with roughly ~61% of borrowers paying a mortgage rate of 4% or less. This dynamic has resulted in few buyers and few sellers in 2023.
U.S. housing affordability is at its worst in 41 years, with the monthly housing cost to income ratio at its highest levels since the early 1980s.
Meanwhile, the supply of completed homes remains constrained due to a decade-plus of underbuilding following the Global Financial Crisis.
But, demographics provide long-term structural support for the U.S. housing market. An upward trend in long-term shelter demand aligning with a muted pace of residential construction – an imbalance of supply vs. demand – has been key in stabilizing home prices through the recent rise in mortgage rates.
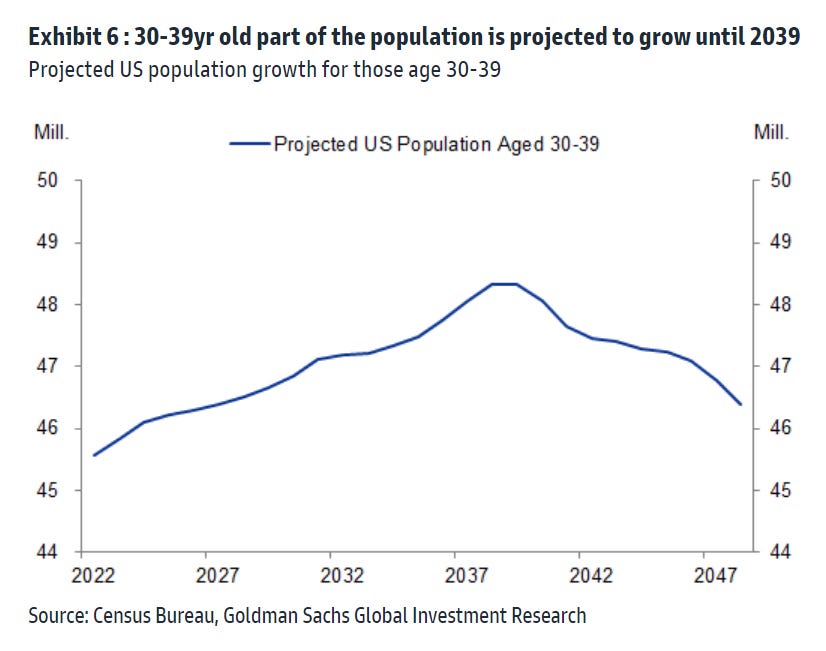
The largest age cohort in the United States is the “Millennials,” or those individuals between their late 20s and early 40s, and the homeownership rate for the average American typically ramps significantly higher between the ages of 30 and 40.
To magnify this trend, the Census Bureau forecasts that the number of Americans in their 30s will grow steadily over the next 15 years, though eventually an aging “Baby Boomer” cohort acts as an offset and will add supply back to the market.
Hopeful home buyers are getting an early holiday gift, though: declining mortgage rates.
Since hitting a 2023 high in late October around 8%, the average 30-year fixed rate has receded by nearly a full percentage point.
Source: Goldman Sachs Global Investment Research, J.P. Morgan Markets, FreddieMac
That’s all for today.
Blake
Welcome to The Sandbox Daily, a daily curation of relevant research at the intersection of markets, economics, and lifestyle. We are committed to delivering high-quality and timely content to help investors make sense of capital markets.
Blake Millard is the Director of Investments at Sandbox Financial Partners, a Registered Investment Advisor. All opinions expressed here are solely his opinion and do not express or reflect the opinion of Sandbox Financial Partners. This Substack channel is for informational purposes only and should not be construed as investment advice. The information and opinions provided within should not be taken as specific advice on the merits of any investment decision by the reader. Investors should conduct their own due diligence regarding the prospects of any security discussed herein based on such investors’ own review of publicly available information. Clients of Sandbox Financial Partners may maintain positions in the markets, indexes, corporations, and/or securities discussed within The Sandbox Daily. Any projections, market outlooks, or estimates stated here are forward looking statements and are inherently unreliable; they are based upon certain assumptions and should not be construed to be indicative of the actual events that will occur.


