The Sandbox Daily (10.10.2022)
3rd quarter earnings season preview, bear markets, S&P 500 sector attribution, long-duration bonds, and the world's GDP deconstructed
Welcome, Sandbox friends.
Today’s Daily discusses the 3rd quarter earnings preview from Goldman Sachs, the history of bear markets for the S&P 500 index, sector attribution for S&P 500 year-to-date performance, new lows for long-duration bonds, and the distribution of the world’s Gross Domestic Products (GDP).
Let’s dig in.
Markets in review
EQUITIES: Dow -0.32% | Russell 2000 -0.60% | S&P 500 -0.75% | Nasdaq 100 -1.02%
FIXED INCOME: Barclays Agg Bond -0.45% | High Yield -1.22% | 2yr UST 4.308% | 10yr UST 3.955%
COMMODITIES: Brent Crude -0.34% to $95.89/barrel. Gold -1.75% to $1,679.4/oz.
BITCOIN: -1.96% to $19,056
US DOLLAR INDEX: +0.23% to 113.001
CBOE EQUITY PUT/CALL RATIO: 0.88
VIX: +3.48% to 32.45
3rd quarter earnings preview
Goldman Sachs has released its third quarter earnings preview ahead of the banks which are set to kick things off later this week. The S&P 500 index is currently down -24% heading into 3rd quarter earnings season starts – consensus expects +3% YoY earnings-per-share (EPS) growth, +13% sales growth, and a -0.75% margin contraction to 11.8%. Excluding the Energy sector, EPS is expected to fall by -3% and margins to contract by 1.3%.
Goldman Sachs expects smaller positive surprises in 3Q compared with 1H 2022 and negative revisions to 4Q and 2023 consensus estimates.
Topics for managements to discuss: (1) headwind to sales due to a stronger US dollar, (2) headwind to margins due to elevated inflation and high inventories, (3) tax changes effective in 2023.
The 3Q profit outlook deteriorated as the quarter progressed. At the start of July, consensus expected YoY EPS growth of +10% but that has since been lowered to +3% – reference the navy blue line in the chart below. The major culprit of the reduced earnings growth was a degradation in the outlook for margins attributable to persistent input cost pressures and elevated wage growth.
Source: Goldman Sachs Global Investment Research
S&P 500 bear markets
How does the 26% decline on the S&P 500 index over the past 8 month compare to other bear markets? Here’s a table going back to 1929. What it shows is high variability from one bear market to the next, with an average/median decline of 36%/29% over an average/median duration of 14/12 months. You’ll also notice from the stats at the bottom of the table is the tendency for recessionary bear markets to be longer and deeper than non-recessionary bears.
Source: Charlie Bilello
S&P 500 sector attribution
Through last week, the Technology sector accounted for close to 40% of the S&P 500's decline since its peak on January 3rd.
Source: Bespoke Investment Group
New lows for long-duration bonds
The bond market was closed for a federal holiday in the United States, but that didn’t stop the iShares 20+ Year Treasury Bond ETF (TLT) from printing a fresh low – and sinking to its lowest level in more than a decade – as it fell below $100 for the first time since 2011.
It's fallen for six consecutive weeks now, a clear reflection of the surge in yields since August 1st. $TLT needs to reclaim those 2013 lows in the near term, otherwise, there's no clear support until it reaches the 2011 lows around $88.
Source: The Chart Report, Ian McMillan, CMT
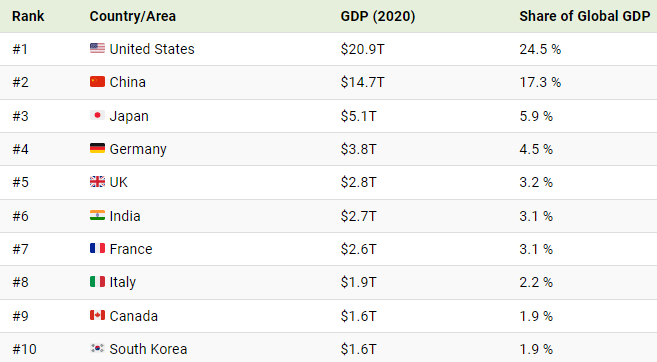
The world’s largest economies, sized by GDP
Global Gross Domestic Product (GDP) has grown massively over the last 50 years, but not all countries experienced this economic growth equally. In 1970, the world’s nominal GDP was just $3.4 trillion. Fast forward a few decades and it had reached $85.3 trillion by 2020. And thanks to shifting dynamics, such as industrialization and the rise and fall of political regimes, the world’s largest economies driving this global growth have changed over time. The United States and China have seen their percentages increase over the last few decades, while Russia and Japan have shrunk.
Source: Visual Capitalist
That’s all for today.
Blake
Welcome to The Sandbox Daily, a daily curation of relevant research at the intersection of markets, economics, and lifestyle. We are committed to delivering high-quality and timely content to help investors make sense of capital markets.
Blake Millard is the Director of Investments at Sandbox Financial Partners, a Registered Investment Advisor. All opinions expressed here are solely his opinion and do not express or reflect the opinion of Sandbox Financial Partners. This Substack channel is for informational purposes only and should not be construed as investment advice. Clients of Sandbox Financial Partners may maintain positions in the markets, indexes, corporations, and/or securities discussed within The Sandbox Daily.


