

The Sandbox Daily (7.21.2022)

Welcome, Sandbox friends.
Today’s Daily discusses the recent breadth thrust, European Central Bank 50 bps rate hike, the 2-10 TSY inversion, oil field productivity, earnings estimates (cautiously) coming down, CD yields, non-traditional sentiment indicators, gasoline prices, and the 10 largest employers of the S&P 500.
Let’s dig in.
EQUITIES: Nasdaq 100 +1.44% | S&P 500 +0.99% | Dow +0.51% | Russell 2000 +0.48%
FIXED INCOME: Barclays Agg Bond +0.83% | High Yield +1.18% | 2yr UST 3.095% | 10yr UST 2.882%
COMMODITIES: Brent Crude Oil -2.59% to $105.81/barrel. Gold +1.04% to $1,735.6/ounce.
BITCOIN: +0.46% to $23,192
VIX: -3.22% to 23.11
CBOE EQUITY PUT/CALL RATIO: 0.62
US DOLLAR INDEX: -0.45% to 106.598
Best breadth thrust in over 3 years
There has been great excitement about market “breadth”; broad-based advances including the great majority of stocks inspire greater confidence than narrower advances. And this week saw the broadest advance for the S&P 500 (defined as the number of advancing stocks minus the number of decliners) since the day after Christmas in 2018, when there had just been a spectacular selloff. Breadth thrusts are an important stage of the bottoming process and tend to cluster together near the beginning of new bull markets.
The Tuesday 7/19 reading saw advancers outnumber decliners by more than 14:1 on the NYSE, and that comes on the heels of a nearly 8:1 reading on Friday 7/15, which at the time was the best reading since May of this year. Data on the S&P 500 was similar, with 98% of stocks advancing, the most since December 26, 2018, the first trading day after the market bottom that occurred on December 24, 2018.

We're also looking at the % of stocks in the S&P 500 making new 20 day highs. We saw over 40% of stocks hit new 20 day highs this week. We're looking for 55% to categorize this one as a true breadth thrust:

To be clear, the S&P 500 is not out of the woods yet, but the strong advance on Tuesday finally pushed the index to a close above the 50-day moving average for the first time since April 20 and these breadth thrusts could be evidence of new trends emerging.
Source: Bloomberg, LPL Research, All Star Charts
ECB raises rates by half-percentage point in first rate hike since 2011
Today was all about the European Central Bank, where the ECB raised interest rates by a larger-than-expected 50bps and unveiled a new plan to buy the debt of Europe’s most vulnerable economies, taking bold action to protect the currency union. The move takes the ECB’s key interest rate to zero, ending the bloc’s eight-year experiment with negative interest rates. In Europe, inflation is soaring, growth is slowing, the energy and gas markets have been rocked by the Russia-Ukraine conflict, and political uncertainty is elevated.

Source: Wall Street Journal
Are the rate markets signaling another recession?
Several indicators get highlighted in financial media in which the market closely watches to gauge the risk of recession. The signal from the yield curve is one to which I always assign great value. In particular, the 2/10 year portion of the curve has the best track record in predicting business and economic cycles. Over the past 50 years, the curve has inverted 6 times, and 6 recessions followed. This signal never generated a false positive. Today, the spread between short-dated Treasury maturities (2-year) and longer-dated Treasuries (10-year) is -0.21%.

Source: Sandbox Financial Partners
Oil production
Compared to one year ago, the change in daily oil and natural gas production is nothing remotely close to the marginal increase in rig counts. Why? Most oil and gas production today is via horizontal drilling that extracts smaller volumes from each ‘lateral’, which depletes relatively rapidly without further action, such as by drilling a new bore, or even extending the length or changing the angle of the lateral. This requires continued capital expenditure.
This phenomenon also has implications for an inflationary environment that are not generally discussed or understood. 20 years ago, if oil producers failed to secure funding for new well development or failed to secure new or renewed drilling leases, the production results in the near term would have been little changed. The existing vertical wells would simply have kept producing. Today, production will fall rapidly in the absence of continued new investment. Yet another structural inflationary pressure point.

Source: Horizon Kinetics
Earnings estimates are slipping as analysts update their forward numbers (but not enough)
Analysts are giddy about inflation peaking and not fully factoring in rising interest rates into their 2H22 & FY23 $SPY EPS estimates. While encouraged the battle against inflation is now going in the right direction, we are discouraged companies and sell-side analysts remain too optimistic, even though S&P 500 EPS growth expectations are starting to drop this month. Interestingly, stocks have stopped following the declines in future earnings. Let's see if this continues as we enter the big wave of corporate earnings.

Source: Hamilton Lane, The Earnings Scout
CD yields show signs of life after COVID
Rates on one-year certificates of deposit – which are closely tied to the short-term interest rates determined by the Federal Reserve – have surged this year from near-zero levels and now they’re roughly back where they were before the COVID crisis. Rates on one-year CDs are still only around ~1%, which in real terms (adjusted for inflation) the purchasing power of your savings would decline by roughly 8% over the next year if the last year's rate of inflation continues. But given the volatility and price declines in both the stock and bond markets, earning more than 0% on cash seems relatively attractive.
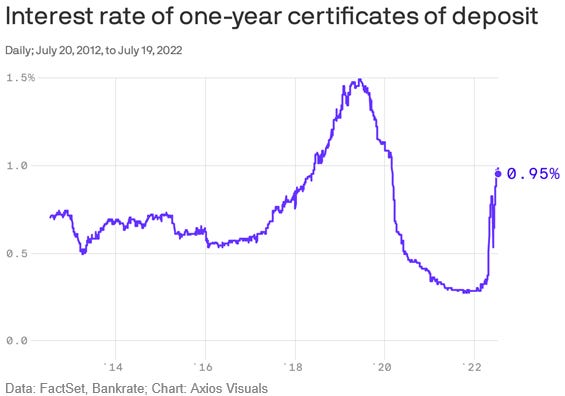
Source: FactSet, Bankrate, Axios
Sentiment indicators reach max pessimism
One Goldman Sachs trader noted the top client question last week was “why did the market not go down in the face of incredibly worsening data?” The bearish trade is very consensus, with sentiment at historically weak levels and positioning washed out. Contrarian indicator? This type of setup allows for markets to snap-back, as we’ve witnessed thus far this week.

Source: ZeroHedge
Gasoline prices, explained
With the Consumer Price Index (CPI) soaring to 40+ year-highs at 9.1% annualized, Americans are feeling the pain perhaps most at the gas pump. Per AAA Gas Prices, the national average gas price is currently $4.44/gal, which is actually down from the recent June high of $5.01/gal – thanks to gas prices declining for the 37th consecutive day! This info-chart helps explain the exogenous shocks and supply/demand dynamics that have led to this point.
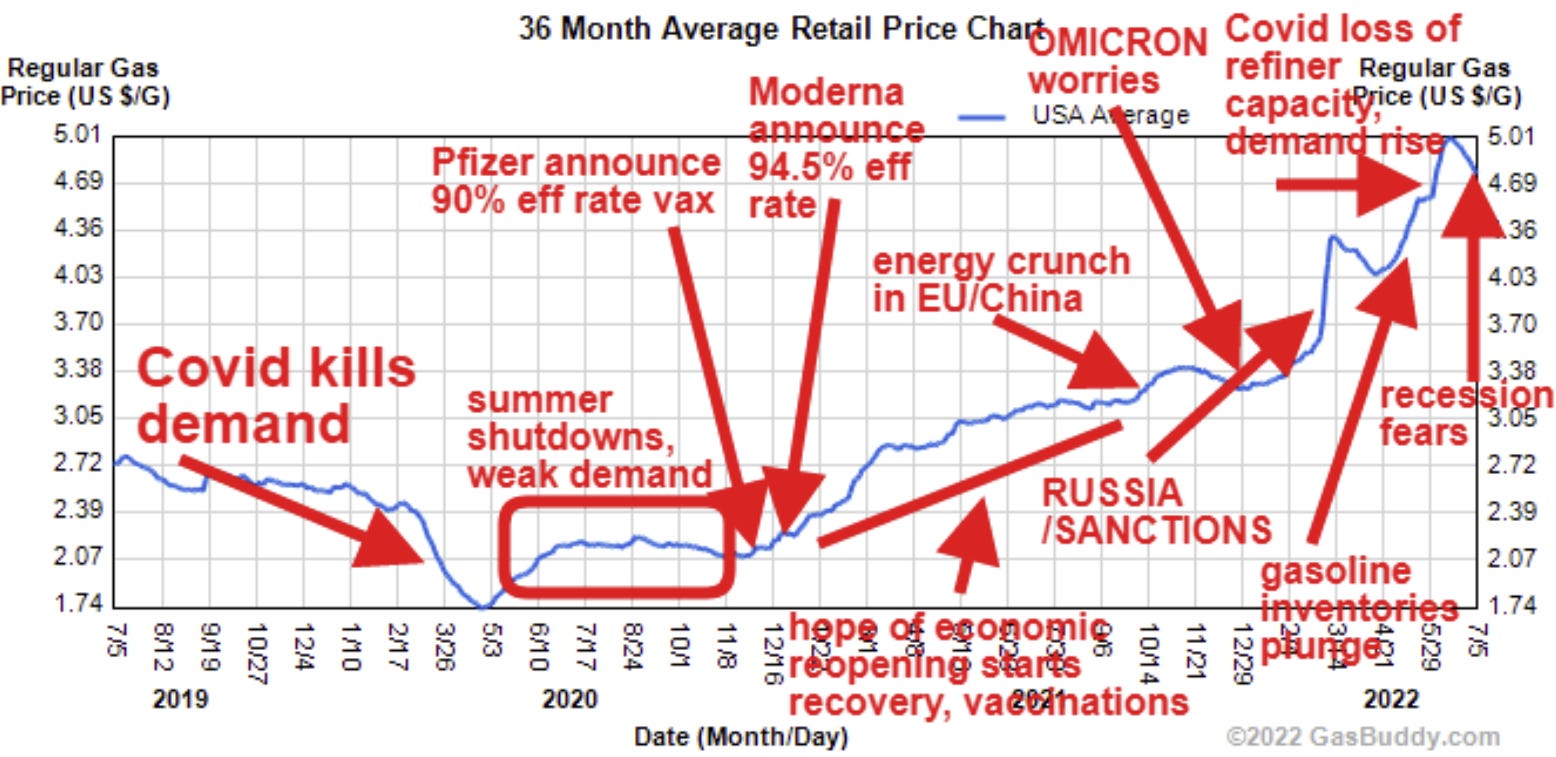
Source: AAA Gas Prices, Gas Buddy
10 largest employers in SPX
Employment trends for the 10 largest employers in the S&P 500.

Source: The Daily Shot, Bloomberg
That’s all for today.
Blake