

The Sandbox Daily (7.28.2022)

Welcome, Sandbox friends.
Today’s Daily discusses the second consecutive quarter of negative GDP growth in the United States, technical analysis 101 on market structure, a review of Meta Platforms Inc. (META) earnings announcement, S&P 500 returns on 2022 Fed announcement days, percentage below 52-week high and percentage above 52-week low for markets around the world, and what crypto needs to thrive.
Let’s dig in.
EQUITIES: Russell 2000 +1.34% | S&P 500 +1.21% | Dow +1.03% | Nasdaq 100 +0.92%
FIXED INCOME: Barclays Agg Bond +0.70% | High Yield +1.02% | 2yr UST 2.868% | 10yr UST 2.671%
COMMODITIES: Crude Oil +0.34% to $107.84/barrel. Gold +1.24% to $1773.0/ounce.
BITCOIN: +5.73% to $23,961
VIX: -5.87% to 22.33
CBOE EQUITY PUT/CALL RATIO: 0.66
US DOLLAR INDEX: -0.25% to 106.182
Technical recession is here: real GDP contracts again in Q2
Real GDP shrank at a -0.9% annual rate in Q2, contrary to the consensus of a +0.3% gain, but largely in line with the latest estimate of -1.2% from the GDP Now Model. It was the second consecutive decline in output, provoking discussions whether the economy is already in recession. Consumer spending growth slowed notably, while capex and residential investment declined, as high inflation and rising interest rates took a bite out of demand. With the Fed hiking rates yesterday and vowing to stay the policy course until inflation subsides, demand will likely slow further in the coming quarters, raising the risk of recession by yearend or in early 2023.
The biggest drag on growth came from inventory investment, which fell by $106.9 billion to an $81.6 billion annual rate, led by retailers (mostly general merchandise and vehicles). It subtracted 2.0 percentage points from real GDP growth, the most in five quarters. The inventory correction is an expression of the bullwhip effect, where excess inventories accumulated during the pandemic across the inventory pipeline are now being unwound.
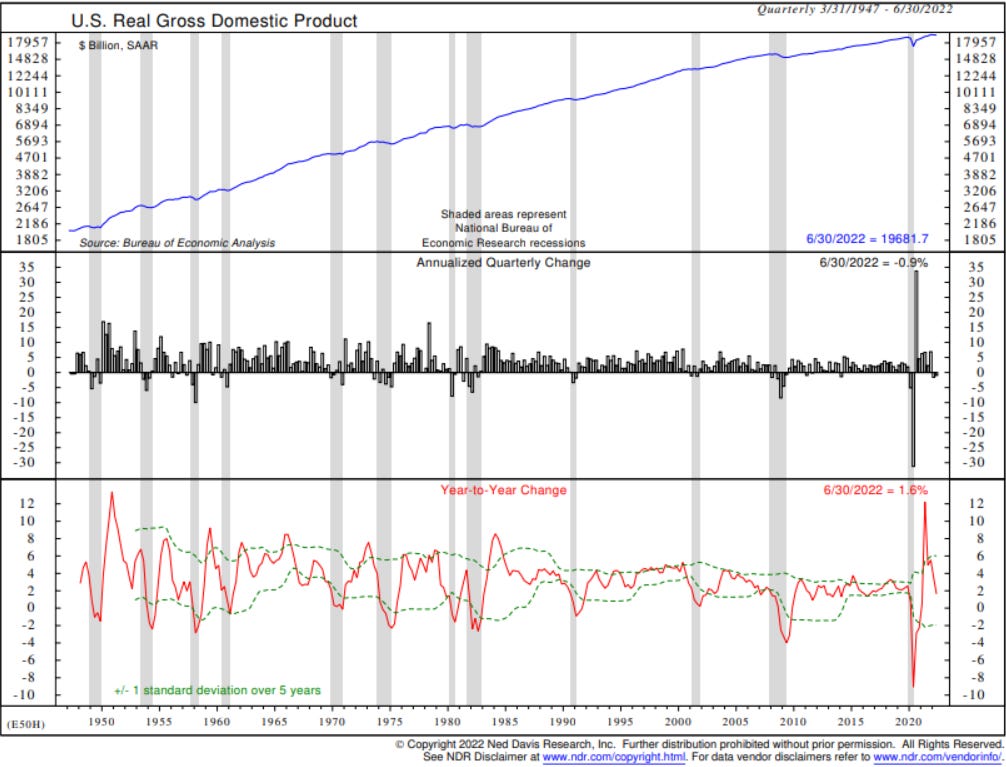
Source: Ned Davis Research
Technical analysis 101: follow the flow
Different educational and training backgrounds lead to different investment processes and disciplines. Academia often focuses on cash flows and discount models with return patterns falling under a normal statistical distribution, while technical analysis in practice tends to focus on money flow, which leads to price discovery, trends, and momentum. This visualization of market structure helps explain money flow through four distinct periods: accumulation, uptrend, distribution, and downtrend.

Look no further than Bitcoin’s chart history to represent this discipline, which gives investors a greater understanding of market structure and improves their investment process:
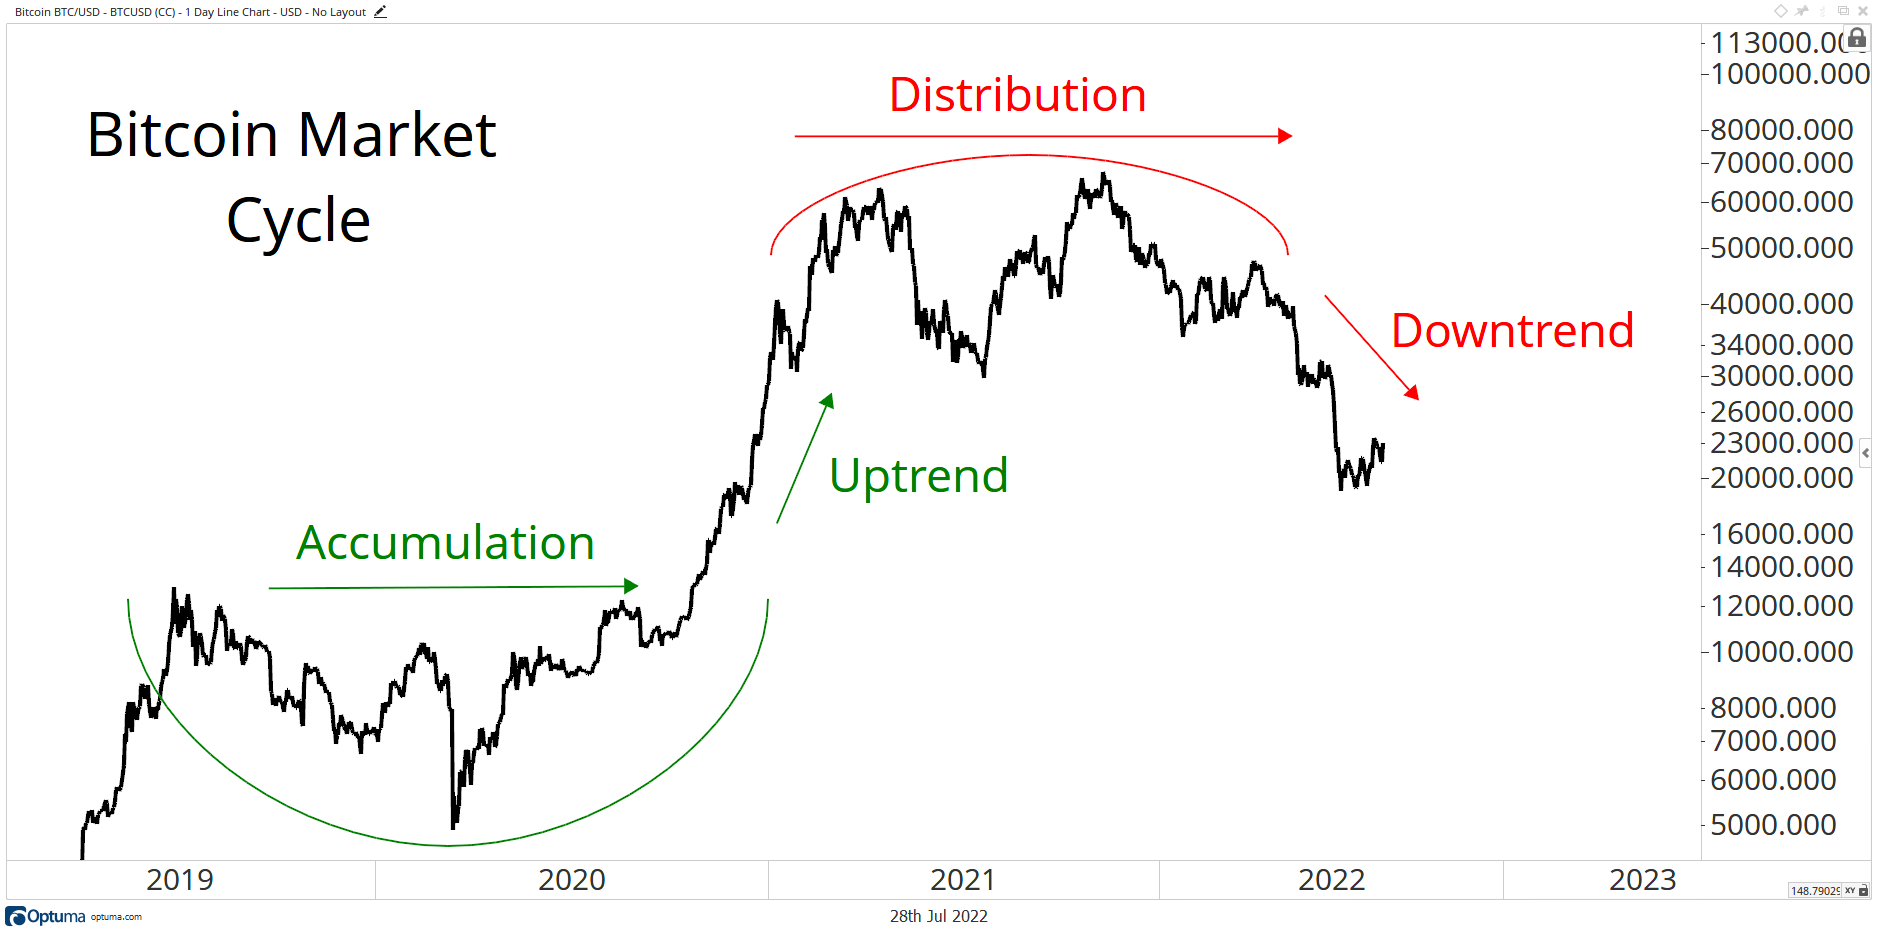
Source: Alpha Trends, Louis Sykes
Meta falls as sales miss estimates in first-ever quarterly drop
Meta Platforms Inc. (META), the social media giant that includes Facebook, Instagram and Whatsapp, reported its first-ever YoY quarterly sales decline, citing advertisers’ shrinking budgets. Meta revenue slipped to $28.8 billion in the second quarter, missing the $28.9 billion average analyst estimate. Chief Executive Officer Mark Zuckerberg said on the earnings call: “We seem to have entered an economic downturn that will have a broad impact on the digital advertising business. The situation seems worse than it did a quarter ago.” Meta is undergoing a period of immense change: expanding firm-wide R&D for metaverse development, promoting more Reels use in its apps in direct competition with ByteDance Ltd.’s TikTok app, adjusting their algorithms to focus on shifting promotion of content from non-followers, adjusting to new leadership after outgoing COO Sheryl Sandberg, to name a few.

Source: Bloomberg, #META
S&P 500 returns on 2022 Fed announcement days
S&P 500 reaction the day-of and the day-after a rate hike in 2022, with great follow through in today’s session:
Day-of $SPX return
3/16: +2.24%
5/4: +2.99%
6/15: +1.46%
7/27: +2.62%
Day-after $SPX return
3/17: +1.23%
5/5: -3.56%
6/16: -3.25%
7/28: +1.21%
Source: Sandbox Financial Partners, YCharts
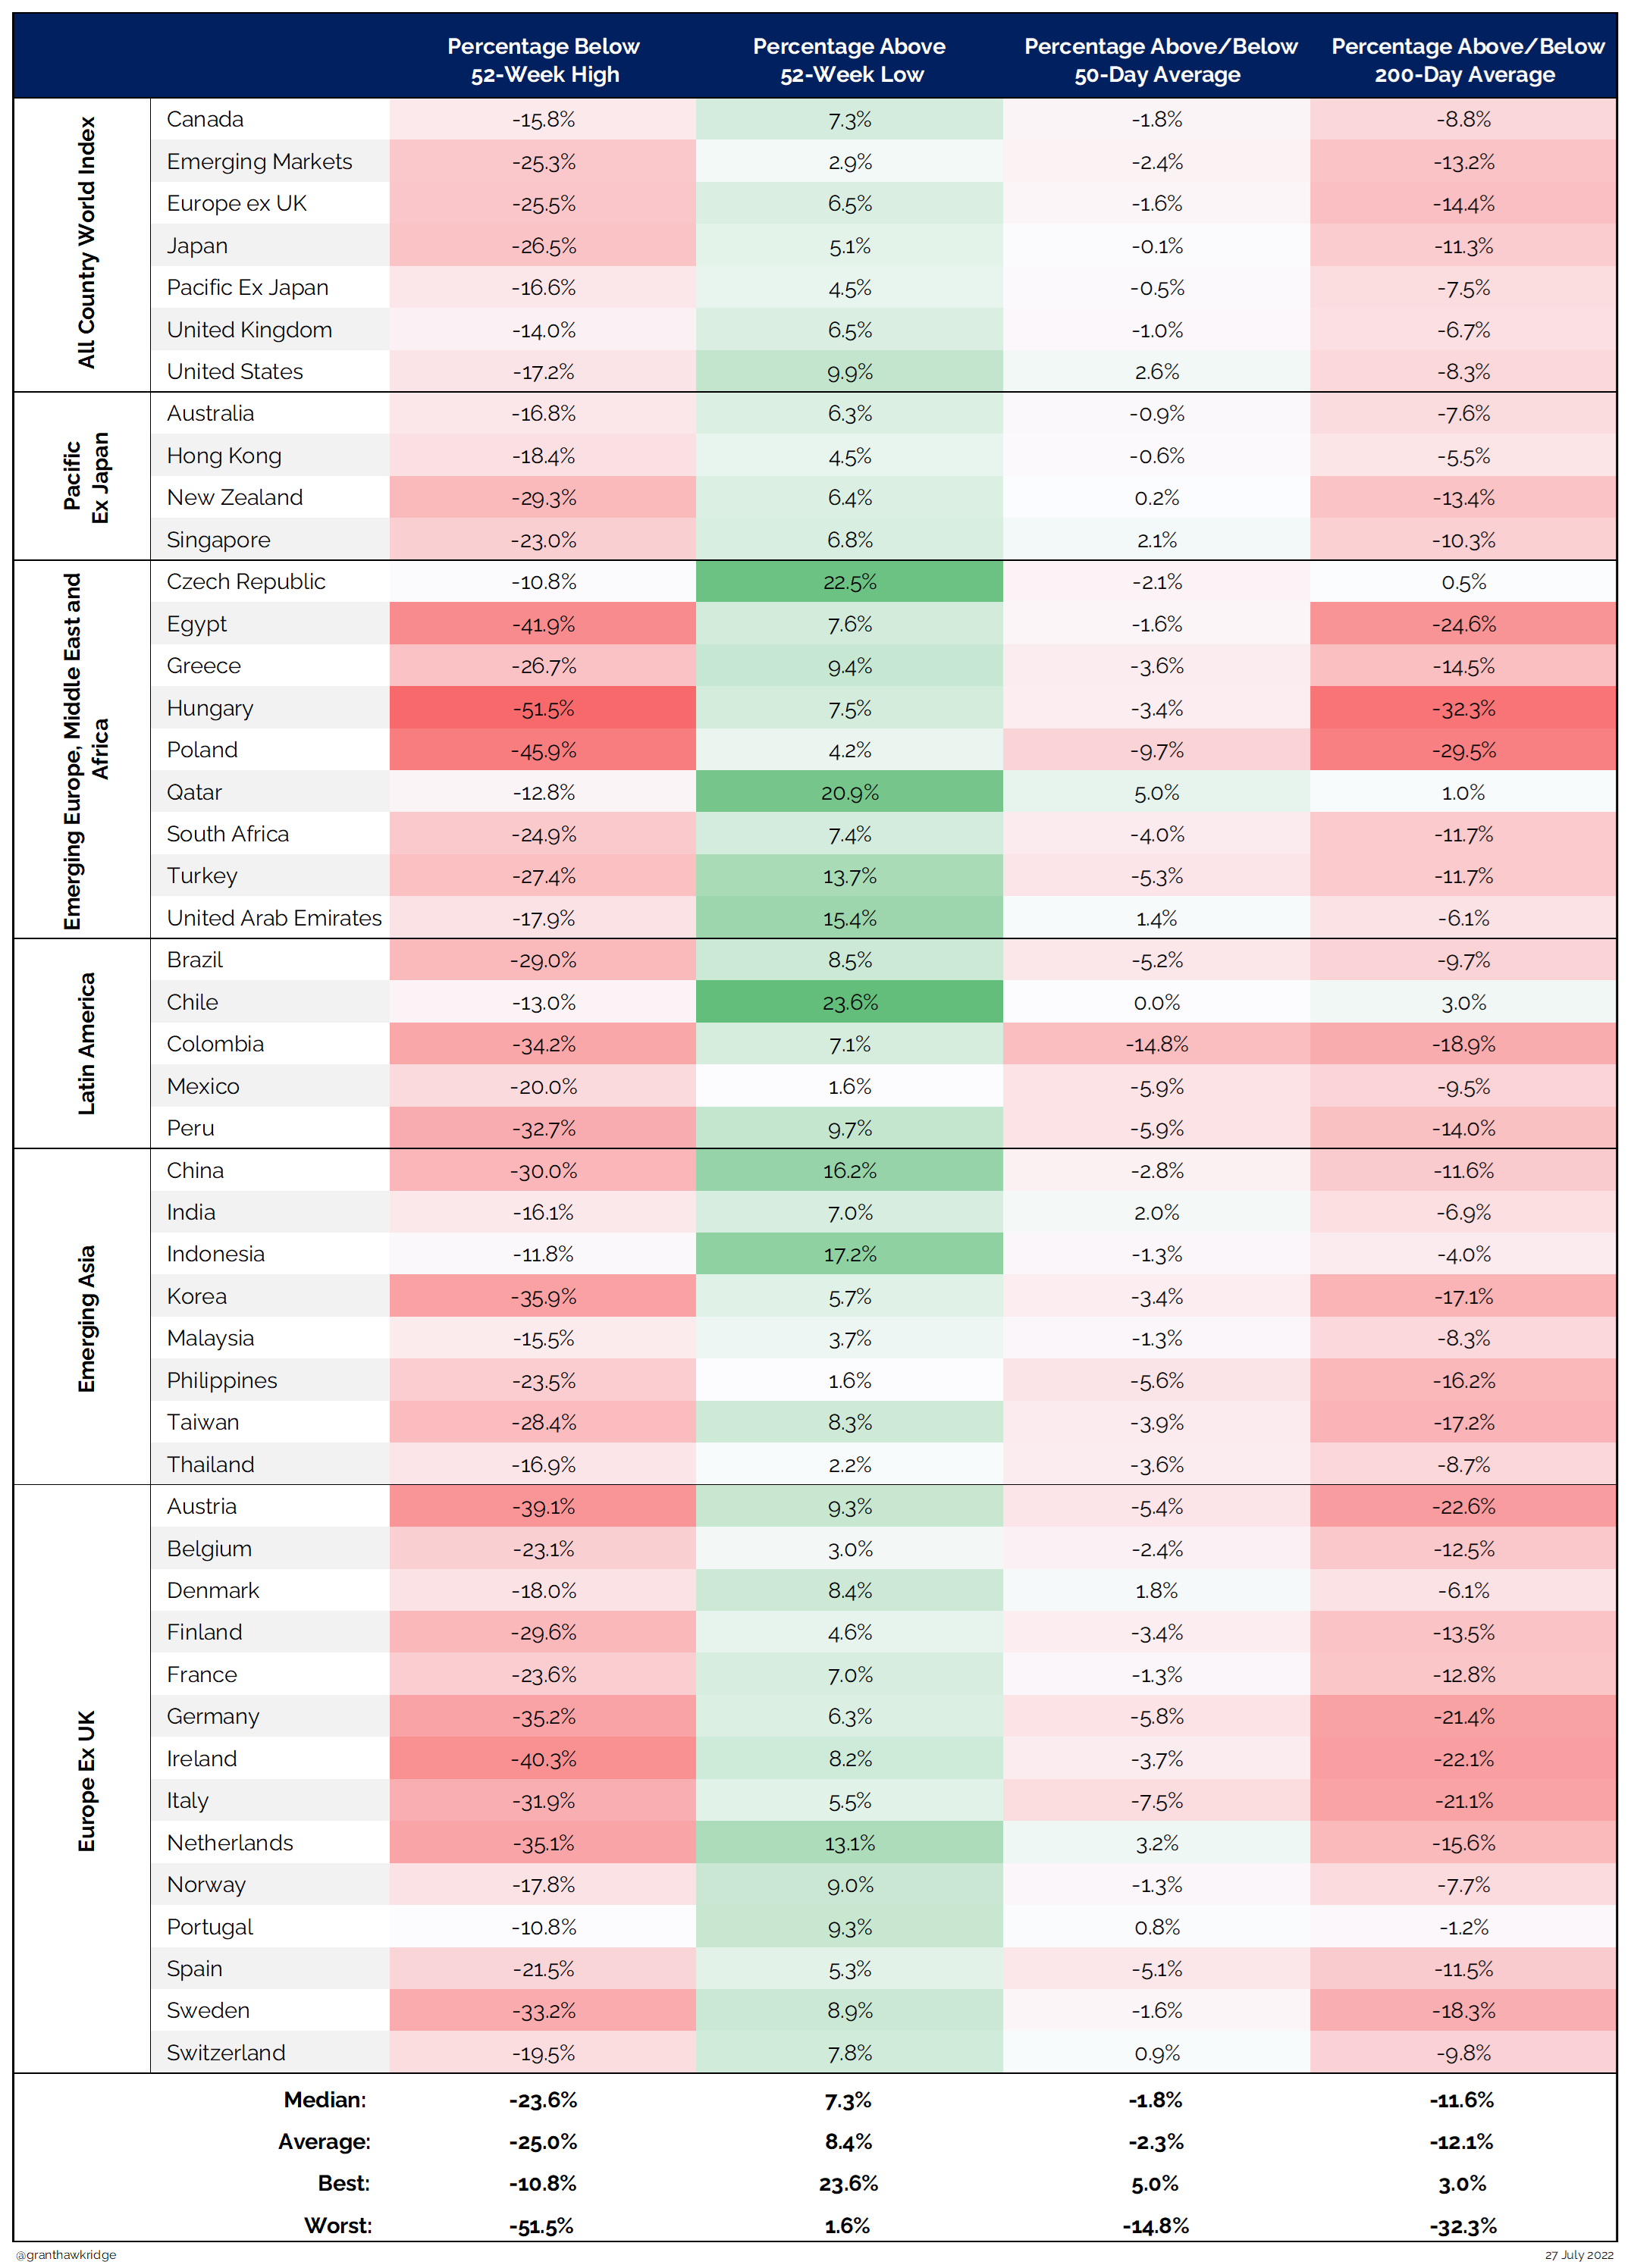
Perfect symmetry
The median market around the world is 23% below its 52-wk highs.
Here in the United States, bear markets (and near bears) that take place without a recession average -23.8% peak to trough. For context, the current bear was -23.6%.
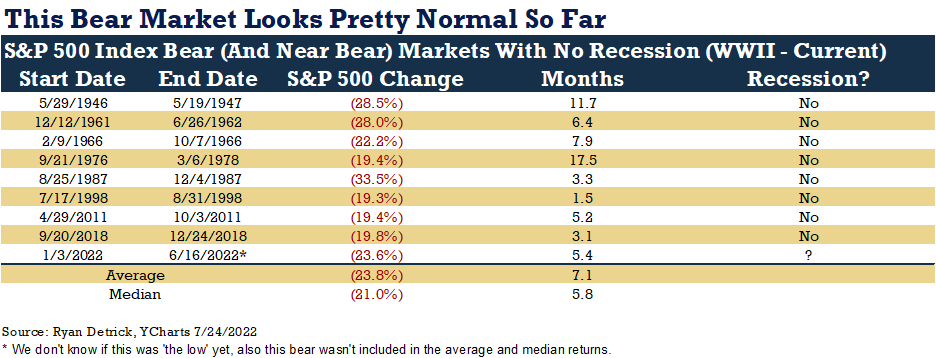
Source: Grant Hawkridge (All Star Charts), Ryan Detrick (Carson Group LLC)
What crypto needs to thrive
What's it going to take for Bitcoin and Crypto to start doing well again? A weaker Dollar is what Crypto needs. The inverse correlation between these two assets is crystal clear: 2017 (crypto up, dollar down), 2018-2019 (crypto winter, dollar rallying), 2020 (greatest wealth creation in digital asset history, dollar getting crushed). The dollar bottomed last spring and these asset classes have moved in opposite directions ever since.

Source: JC Parets, All Star Charts
That’s all for today.
Blake
Welcome to The Sandbox Daily, a community of market participants for market participants to encourage thought leadership and embrace intellectual enlightenment.
Blake Millard is the Director of Investments at Sandbox Financial Partners, a Registered Investment Advisor. All opinions expressed here are solely his opinion and do not express or reflect the opinion of Sandbox Financial Partners. This Substack channel is for informational purposes only and should not be construed as investment advice. Clients of Sandbox Financial Partners may maintain positions in the markets, indexes, corporations, and/or securities discussed within The Sandbox Daily.