The Sandbox Daily (8.10.2022)
Reflecting on today's Consumer Price Index (CPI) July report
Welcome, Sandbox friends.
Today’s Daily discusses the talk of the tape -> the Consumer Price Index (CPI) report.
Let’s dig in.
EQUITIES: Russell 2000 +2.95% | Nasdaq 100 +2.85% | S&P 500 +2.13% | Dow +1.63%
FIXED INCOME: Barclays Agg Bond +0.25% | High Yield +1.50% | 2yr UST 3.216% | 10yr UST 2.786%
COMMODITIES: Brent Crude +0.83% to $97.11/barrel. Gold -0.26% to $1,807.6/oz.
BITCOIN: +3.21% to $23,849
VIX: -9.32% to 19.74
CBOE EQUITY PUT/CALL RATIO: 0.70
US DOLLAR INDEX: -1.08% to 105.227
US inflation runs cooler than forecast, easing pressure on Federal Reserve
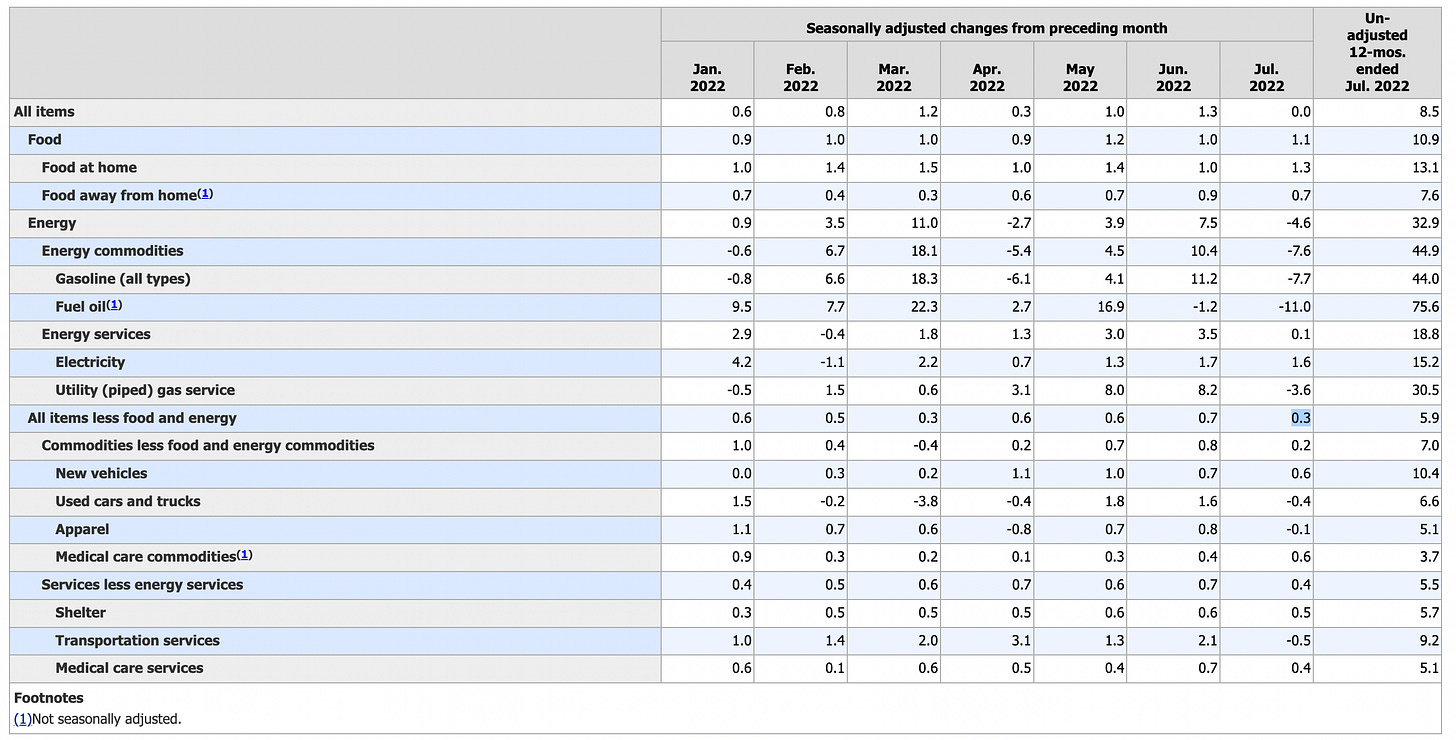
The Consumer Price Index (CPI) increased 8.5% from a year earlier, ticking down from the 9.1% June advance that was the largest in four decades. Economists were expecting an 8.7% YoY increase.
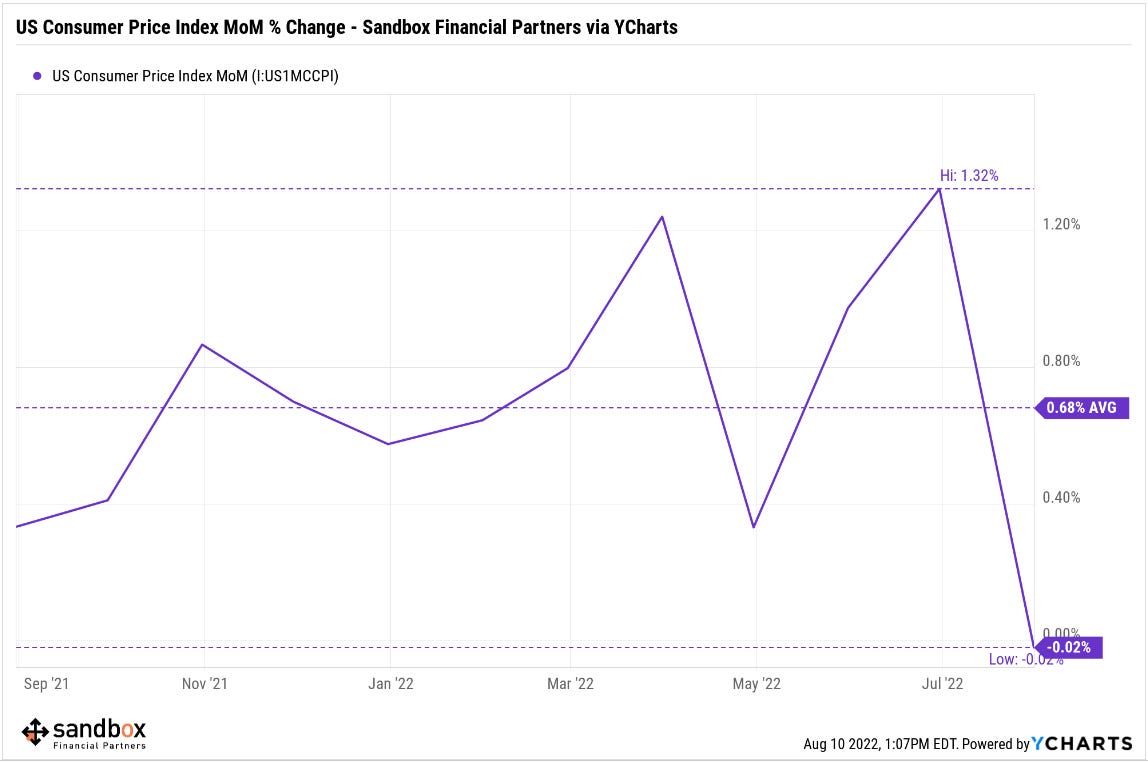
Prices were largely unchanged from the prior month as the July month-over-month read was a change of -0.02%, a stark difference from the 0.68% average monthly gain we’ve experienced over the previous 12 months. Much of the relief came from a 4.6% decline in energy prices, the most since April 2020, with both gasoline and natural gas prices sliding. Food prices, however, continued to ascend, up 1.1%, its seventh consecutive gain of 0.9% or more, driven by higher grocery prices.
Core CPI, which strips out the more volatile food and energy components, rose 0.3% from June and 5.9% from a year ago, but has declined 4 consecutive months.
Leading inflation indicators – including gasoline, travel-data, commodities – showed the official “hard” data was way above the real-time inflation data we’ve been witnessing for weeks. Improving supply chains and bloated retail inventories have provided hope that a long-elusive disinflationary impulse from core goods prices might have finally arrived. It must be noted that the Owners’ Equivalent Rent (OER), ~33% of the CPI basket calculation, advanced +5.8% YoY, the fastest gain since September 1990; the housing and shelter index remains sticky and is a lagging indicator so it will take some time for this component to start moderating.
Fed officials have said they want to see months of evidence that prices are cooling, especially in the core gauge. They’ll have another round of monthly CPI and jobs reports before their next policy meeting on Sept. 20-21.
Source: Sandbox Financial Partners, YCharts, Bloomberg, Ned Davis Research
Fed rate hike expectations turned more dovish
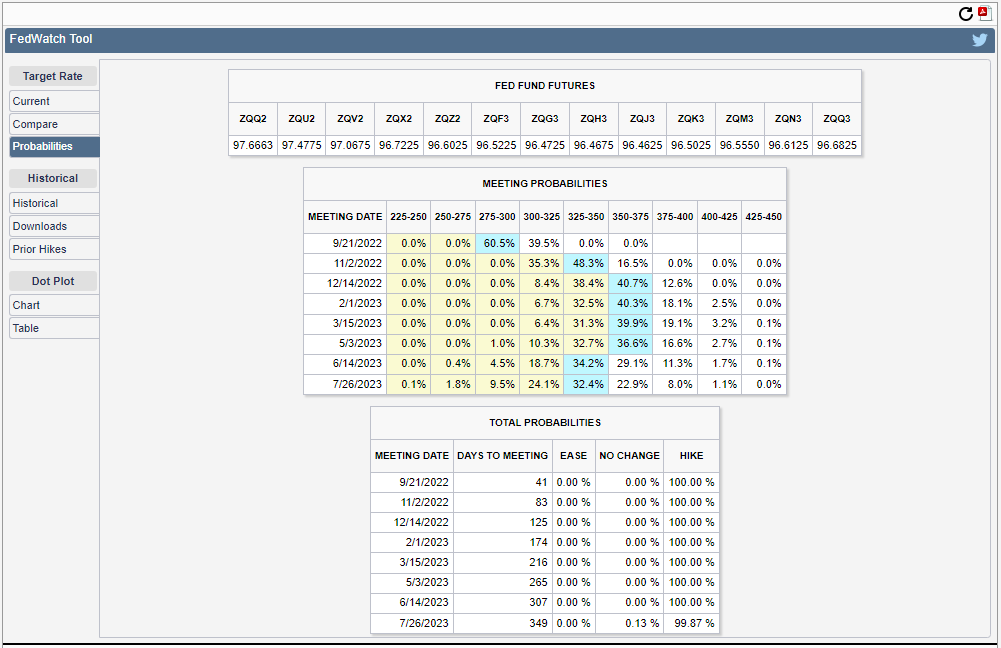
Monetary Policy is front and center when fighting public enemy #1: inflation. With this singular data point, Fed rate hike expectations shifted a bit dovish after the CPI report but the market (Fed Funds Futures) still reflects a narrative that the Federal Reserve has more work to do:
September 21: 50 bps hike to 2.75%-3.00%
November 2: 50 bps hike to 3.25%-3.50%
December 14: <50% chance of 25 bps hike to 3.50%-3.75%
Source: CME FedWatch Tool
VIX collapsed
The CBOE Market Volatility Index (VIX) sank -9.32% today to close at 19.74. Since it’s most recent peak of 34.02 on June 13th, the VIX is down -41.86%.
The VIX closed below 20 today which ended the 10th longest streak of closes above 20 dating back to 1990 – 90 sequential trading days. The last streak of 90 or more trading days ended at 246 in February 2021 coming out of the pandemic. Before that, one must go all the way back to 2012 to find another streak of 90+ trading days. The longest streak of VIX closes above 20 was during the Global Financial Crisis stretching 331 trading days from September 2008 (Lehman Brothers) through December 2009 (9 months off the S&P 500 bottom).
Source: Bespoke Investment Group, ThomsonOne
The dollar is rolling over
The U.S. Dollar Index continued its slide from the July 14th high, down roughly 3% in that period. Long-term support lines up at the 102-103 level (March 2020 highs and 4Q16). If dollar weakness continues, risk assets should continue to catch a bid as the inverse correlation between these two groups has been crystal clear over the last 5 years.
Source: Bloomberg
The inflation gap
US wages are up 5.22% over the trailing 12 months, while consumer prices paid (CPI) have risen 8.52%. The shortfall is 3.30% so “real” savings are impacting the average consumer’s wallet.
So, how are Americans still spending given this large gap between what's coming in (wages) vs. what's going out (CPI)? Well... savings rates are down -> to levels last seen in 2009.
And this means debt balances are growing. Total household debt increased by $312 billion during the second quarter of 2022, and balances are now more than $2 trillion higher than they were in the fourth quarter of 2019, just before the COVID-19 pandemic recession, according to the Quarterly Report on Household Debt and Credit from the New York Fed’s Center for Microeconomic Data.
Source: Sandbox Financial Partners, Liberty Street Economics, Federal Reserve Bank of New York
That’s all for today.
Blake
Welcome to The Sandbox Daily, a daily curation of relevant research at the intersection of markets, economics, and lifestyle. We are committed to delivering high-quality and timely content to help investors make sense of capital markets.


