

The Sandbox Daily (8.11.2022)
$4 gasoline, Nasdaq performance, market breadth, Producer Price Index (PPI), and a resilient labor force recovery

Welcome, Sandbox friends.
Today’s Daily discusses the breakdown in gas prices, quantifying the recent Nasdaq bear and (emerging?) bull market, market breadth metrics becoming more bullish, moderation in the U.S. Producer Price Index (PPI), and the labor force recapturing jobs losses from the pandemic.
Let’s dig in.
EQUITIES: Russell 2000 +0.31% | Dow +0.08% | S&P 500 -0.07% | Nasdaq 100 -0.65%
FIXED INCOME: Barclays Agg Bond -0.55% | High Yield -0.57% | 2yr UST 3.239% | 10yr UST 2.893%
COMMODITIES: Brent Crude +2.17% to $99.51/barrel. Gold -0.62% to $1,802.5/oz.
BITCOIN: +1.73% to $24,069
VIX: +2.33% to 20.20
CBOE EQUITY PUT/CALL RATIO: 0.58
US DOLLAR INDEX: -0.05% to 105.142
$4 gas!
The national average for gasoline prices paid at the pump have fallen for 57 days straight, falling to $3.951 per gallon. The recent high for the national average gas price was $5.034/gal on June 16th. Americans are spending $410 million less on gasoline today vs. the mid-June peak. This is welcome news because the most miles travelled by car occur during the summer months so the impact of falling gas prices is an immediate relief to everyone’s wallet.

Source: GasBuddy
Just your average bear
The 20% rally/decline threshold is the most commonly used to define bull and bear markets. The Nasdaq Composite reached the 20% rally level on a closing basis yesterday, which ended the bear market for the index that began on November 19th, 2021. We could write for hours on the semantics of bull and bear markets, but using the 20% threshold, below is a table of historical bull and bear markets for the Nasdaq Composite.

What is most striking about the just-ended Nasdaq bear market is just how average it was. From peak to trough, the Nasdaq fell 33.7% over 209 calendar days from November 19th, 2021 to June 16th, 2022. The average bear market since 1970 has seen the index fall 35.5% over 201 calendar days.


Source: Bespoke Investment Group
Market breadth metrics becoming more bullish
The NYSE Advance/Decline Line has made a higher high above the now rising 50-day moving average. The S&P 500 Index has done the same. The indicator confirms the recent strength that we have seen in the index.

The percentage of issues on the NYSE trading above their respective 20-day moving averages rose to 81% this week from 79% last week. The S&P 500 is above its rising 20-day moving average.

The percentage of NYSE issues trading above their respective 50-day moving averages rose to 76% from 59% two weeks ago. The S&P 500 is above its rising 50-day moving average.

The percentage of NYSE issues trading above their respective 200-day moving averages moved to 28% this week from 19% two weeks ago. The S&P 500 is now within striking distance of its 200-day moving average.

Source: Potomac Fund Management
US producer prices fall for first time since early in pandemic
A key measure of US producer prices unexpectedly fell in July for the first time in more than two years, largely reflecting a drop in energy costs and representing a welcome moderation in inflationary pressures. The Producer Price Index (PPI), which measures the change in prices that domestic producers receive for their output (think a measure of inflation at the wholesale level), decreased -0.5% in July from a month earlier and rose +9.8% from a year ago (down from +11.3% the previous month). Excluding the volatile food and energy components, the so-called core PPI rose +0.2% from June and +7.6% from a year earlier.
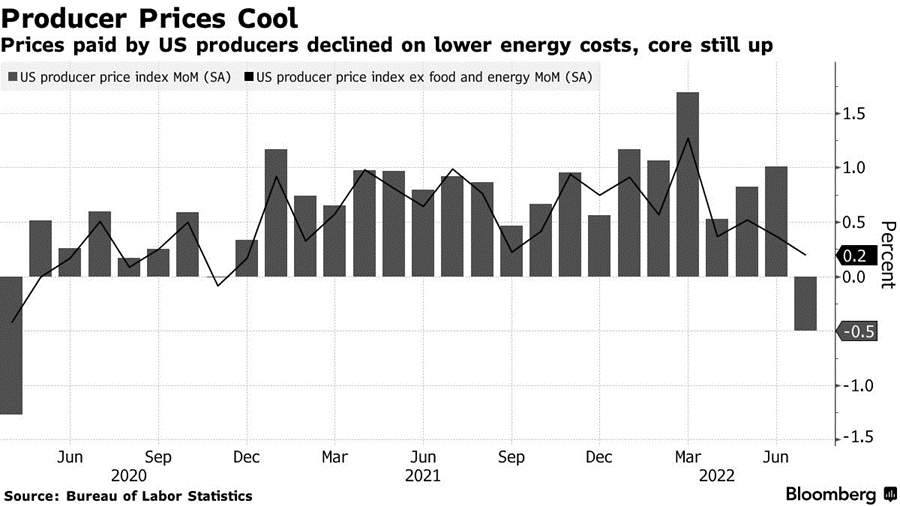
These PPI figures suggest some pipeline inflationary pressures are beginning to ease, which could ultimately temper the pace of consumer price growth in coming months. Commodity prices have dropped sharply in recent months, and there are several indicators showing that supply-chain conditions are improving – suggesting moderation in goods prices for the 2nd half of the year. In back-to-back days, the Labor Department has delivered two reports (CPI + PPI) that present a narrative suggesting some early softness in the inflation data for the Federal Reserve to digest as it pursues its interest rate hiking cycle and other related Quantitative Tightening (QT) measures.
Source: Bloomberg
Labor force shows strength in pandemic recovery
In April 2020 the US economy saw more than 20 million people lose their jobs or exit the workforce. The word "unprecedented" certainly had its day in the sun. The US economy, however, has slowly but surely clawed its way back. Over the last 27 months the US economy has seen the number of people in active employment grow by an average of 800,000 a month — taking total employment in the country back to almost exactly where we were in February 2020. People have returned to the workforce, but with headline inflation running at 8.5% YoY, wages aren't keeping up and people are concerned. Indeed, a recent survey from YouGov found that inflation is now the number one political or social issue for 24% of those surveyed.
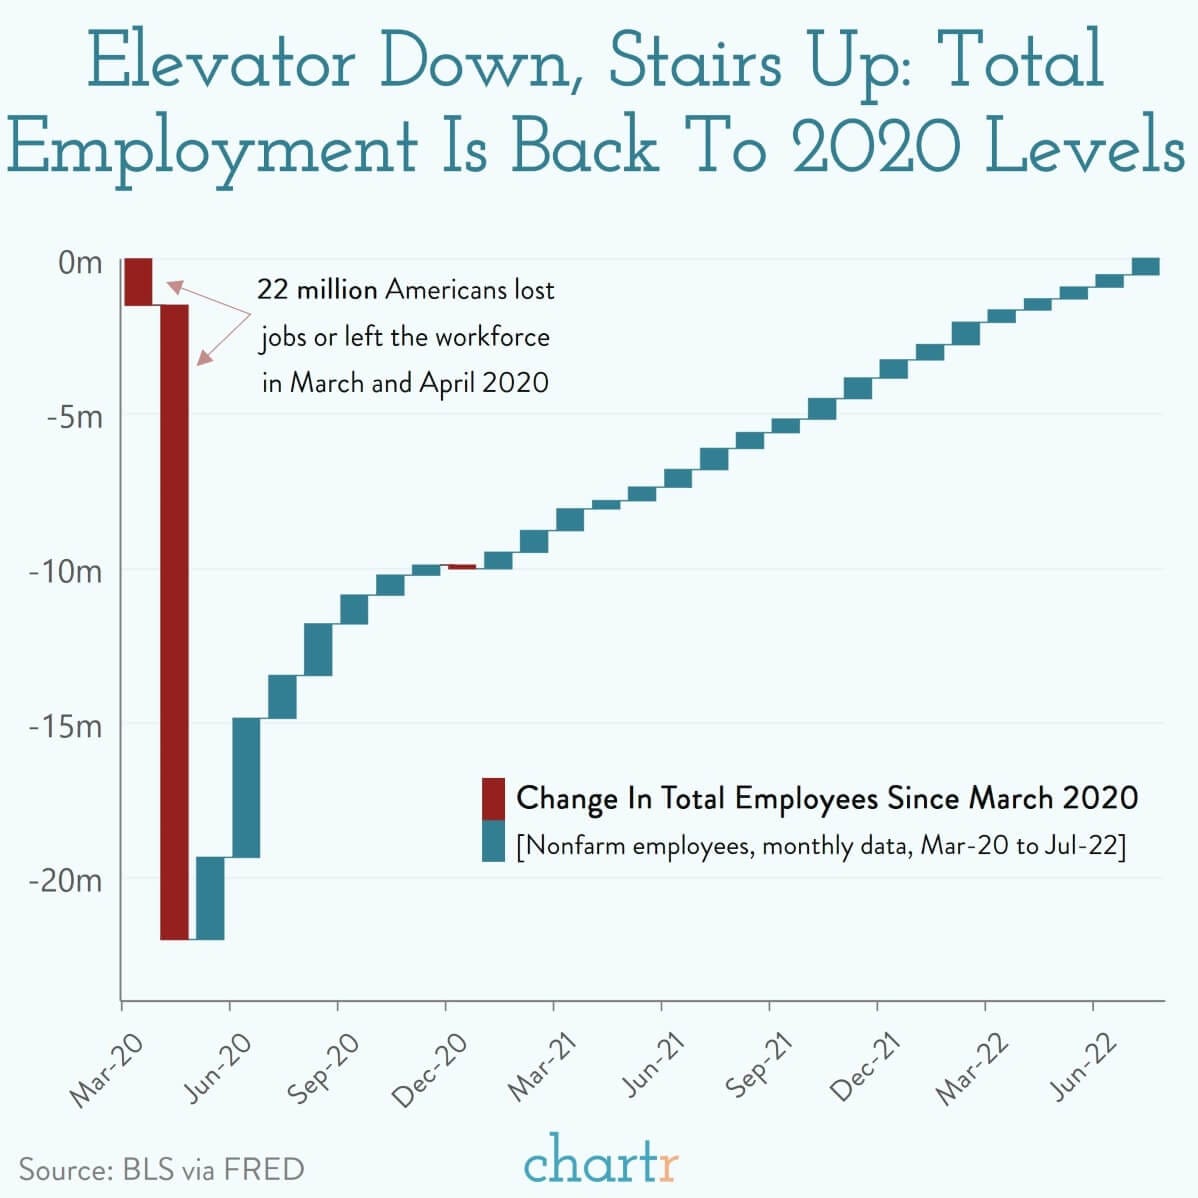
Source: Chartr
That’s all for today.
Blake
Welcome to The Sandbox Daily, a daily curation of relevant research at the intersection of markets, economics, and lifestyle. We are committed to delivering high-quality and timely content to help investors make sense of capital markets.
Blake Millard is the Director of Investments at Sandbox Financial Partners, a Registered Investment Advisor. All opinions expressed here are solely his opinion and do not express or reflect the opinion of Sandbox Financial Partners. This Substack channel is for informational purposes only and should not be construed as investment advice. Clients of Sandbox Financial Partners may maintain positions in the markets, indexes, corporations, and/or securities discussed within The Sandbox Daily.