The Sandbox Daily (8.1.2022)
NBER recession indicators, S&P 500 breadth thrust, ISM manufacturing report, Fed Funds rate, Agency-MBS, and the U.S. Dollar
Welcome, Sandbox friends.
Today’s Daily discusses the six indicators used by the National Bureau of Economic Research (NBER) to determine recessions, S&P 500’s breadth thrust last week, today’s report from The Institute for Supply Management (ISM) on the manufacturing slowdown, market expectations for the neutral Fed Funds rate, the backdrop for agency mortgage-backed securities, and the U.S. dollar backing off recent highs.
Let’s dig in.
EQUITIES: Nasdaq 100 -0.06% | Russell 2000 -0.10% | Dow -0.14% | S&P 500 -0.28%
FIXED INCOME: Barclays Agg Bond +0.29% | High Yield -0.36% | 2yr UST 2.886% | 10yr UST 2.588%
COMMODITIES: Crude Oil -3.67% to $100.15/barrel. Gold +0.42% to $1,789.3/oz.
BITCOIN: -3.27% to $23,021
VIX: +7.08% to 22.84
CBOE EQUITY PUT/CALL RATIO: 0.61
US DOLLAR INDEX: -0.47% to 105.404
Six indicators used to gauge a recession by the National Bureau of Economic Research (NBER)
The National Bureau of Economic Research (NBER), official arbiters of US recessions, look at six monthly indicators in determining whether the nation is officially in a recession and they’re not flashing red. The NBER’s business-cycle labeling committee rejects the common technical notion that two negative quarters of gross domestic product is the definition of a recession. Instead, the NBER looks at a more diverse set of economic indicators beyond gross domestic product: real personal income less transfers, nonfarm payrolls, real personal consumption expenditures, real manufacturing and trade sales, household employment, and the index of industrial production. As such, the NBER defines a recession as “a significant decline in economic activity that is spread across the economy and that lasts more than a few months.” Each of these six indicators has grown since the start of the year, although more recent data on economic output does indicate a loss of momentum across several categories.
Source: Bank of America Global Research
S&P 500 market breadth has dramatically improved
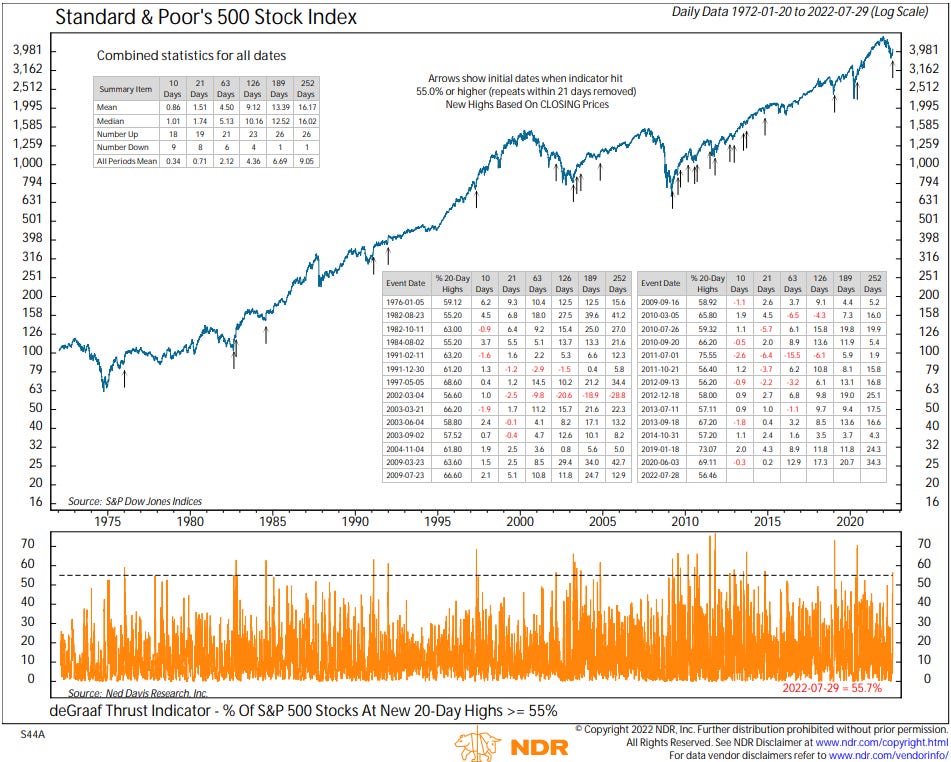
Last week, a rare breadth thrust triggered as the percentage of S&P 500 stocks at 20-day highs spiked above 55% for the first time since June 2020. This signal, popularized by Jeff deGraaf, often marks the start of a multi-month rally. Improved market breadth is an important technical development because this shows a broad-based participation in advancing issues all exhibiting strength simultaneously. This doesn’t proclaim that the bottom is in, but it does strengthen the bull case.
Source: Ned Davis Research
Manufacturing activity moderates further
The Institute for Supply Management (ISM) published its monthly Purchasing Managers Report (PMI) which showed the index edged down -0.2 points in July to 52.8, its lowest level since June 2020, but above the consensus of 52.1. Growth narrowed across industries, with 11 reporting an expansion, the fewest since May 2020, while seven reported a contraction. Most PMI components declined. Production growth moderated to the slowest pace since May 2020, while new orders contracted at the steepest rate also since May 2020, as demand weakened. Inventories backed up at the fastest pace since July 1984. “Panelists are now expressing concern about a softening in the economy, as new order rates contracted for the second month amid developing anxiety about excess inventory in the supply chain,” said Timothy Fiore, chair of ISM’s Manufacturing Business Survey Committee.
US manufacturing activity has continued to cool as more factories dialed back production in the face of shrinking orders and rising inventories. It is consistent with continued growth in manufacturing output and the broader economy, but at a slower pace than earlier in this cycle. The ISM manufacturing index is now down almost 11 points from its multi-decade peak in March of last year, when producers were scrambling to meet pent-up demand as the economy emerged from pandemic lockdowns.
Source: Institute for Supply Management, Ned Davis Research, Bloomberg
Market expectations for Fed Funds neutral rate have receded
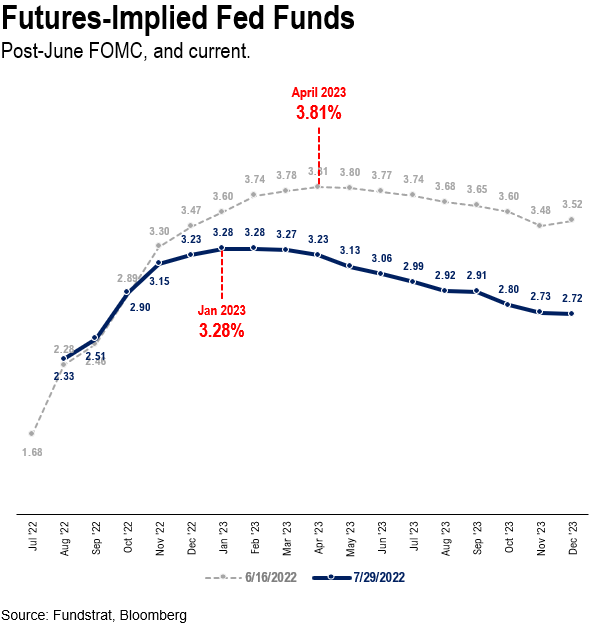
Over the past month, bond markets have drastically reduced their expectations for Fed tightening. This is evidenced by looking at Fed futures below.
after June FOMC, markets saw Fed Funds rate (mid-point) peaking at 3.81% in April 2023
post July FOMC, markets now see Fed Funds peaking at 3.28% in January 2023
53bp less on peak Fed Funds, or 2 hike reduction
Fed funds peaking 3 months earlier
In other words, the bond market made a serious “dovish pivot” in pricing Fed funds into 2023. Is it any wonder that equity markets have found footing in July?
Source: Fundstrat, Bloomberg
Agency mortgage-backed securities (MBS) have faced unique challenges in 2022
Mortgage rates have climbed this year at one of the fastest paces on record. Yields on agency mortgage-backed securities (MBS) have soared to 4.17% in July 2022 from 1.98% in January. Spreads of MBS have widened amid macroeconomic uncertainty, spikes in interest rate volatility, and, most importantly, concerns over the Fed’s runoff and eventual sale of MBS. The spread on agency MBS has surged since last November when the Fed indicated it would stop MBS purchases, from a low of 37 bps before the announcement to 139 basis points (bps) today. As the Fed reduces the MBS asset size of its balance sheet, borrower prepayments and refinancings slow down, and housing turnover comes off the boil, it will be worth watching how the mortgage bond market responds to this difficult backdrop.
Source: PIMCO, Bloomberg
US Dollar backing off recent highs
The U.S. Dollar Index retreated to the June highs at the $105.75 level in last week’s trading session as the greenback continues to digest the recent strength. Long-term support lines up at the 103 level (March 2020 highs), with the bias to the upside so long as the dollar is above this zone. RSI is cooling off from overbought conditions but remains well above the 55 zone that has defined the uptrend. If dollar weakness continues, risk assets should continue to catch a bid.
Source: Potomac Fund Management
That’s all for today.
Blake
Welcome to The Sandbox Daily, a daily curation of relevant research at the intersection of markets, economics, and lifestyle. We are committed to delivering high-quality and timely content to help investors make sense of capital markets.
Blake Millard is the Director of Investments at Sandbox Financial Partners, a Registered Investment Advisor. All opinions expressed here are solely his opinion and do not express or reflect the opinion of Sandbox Financial Partners. This Substack channel is for informational purposes only and should not be construed as investment advice. Clients of Sandbox Financial Partners may maintain positions in the markets, indexes, corporations, and/or securities discussed within The Sandbox Daily.


