

The Sandbox Daily (8.30.2022)
July JOLTS report, supply chains, 2-year Treasury note, Zumper national rent, and Norwegian NatGas

Welcome, Sandbox friends.
Today’s Daily discusses the tight labor market as reported in today’s Job Openings and Labor Turnover (JOLTS) July report, various indicators showing continued moderation in supply chains, the surging 2-year U.S. Treasury yield, the Zumper national renter’s report, and Norway displacing Russia as Europe’s biggest NatGas supplier.
Let’s dig in.
EQUITIES: Dow -0.96% | S&P 500 -1.10% | Nasdaq 100 -1.13% | Russell 2000 -1.45%
FIXED INCOME: Barclays Agg Bond +0.10% | High Yield -0.77% | 2yr UST 3.458% | 10yr UST 3.112%
COMMODITIES: Brent Crude -4.62% to $100.06/barrel. Gold -0.12% to $1,734.3/oz.
BITCOIN: -1.76% to $19,867
US DOLLAR INDEX: +0.05% to 108.822
CBOE EQUITY PUT/CALL RATIO: 0.74
VIX: 0.00% to 26.21
July JOLTS report shows labor market remains tight
Job openings rebounded 1.8% in July to 11.24 million, its first increase in four months. But hires fell 1.1% to 6.4 million, its fifth consecutive decline and the lowest level in nearly a year. While the number of open positions suggests labor demand remains close to a record high, the decline in hires points to a slowdown in the job matching process, likely due in part to a decline in labor supply. Indeed, the number of unemployed workers and the broader pool of available labor both shrank in July. There continue to be nearly twice as many job openings as unemployed workers (1.98x), implying continued upward pressure on wage growth.

The Quit Rate remains historically elevated at 2.7% but the rate has backed off from the record 3.0% at the end of last year, which suggests worker confidence in their job prospects and mobility remains high.

Put together, the indicators in the July Job Openings and Labor Turnover (JOLTS) report show that labor market conditions remain extremely tight and imply that the Fed will continue to hike rates aggressively. The job market has been a bright spot in an economy otherwise losing momentum and possibly heading toward a recession.
Source: Bureau of Labor Statistics, Ned Davis Research, Bloomberg
Supply chains continue easing process
Supply chain bottlenecks continue to ease, as demonstrated by meaningful improvements across various supply chain metrics. Reviewing high-frequency leading indicators show supply and demand dynamics of physical goods in real time. Softening of these metrics is welcome news for headline inflation.
The New York Fed Global Supply Chain Pressure Index (GSCPI) peaked in December 2021 and is firmly in a down channel since. The GSCPI uses a data set of 27 sub-component variables to provide a comprehensive perspective on the state of supply chains across different regions, delivery methods, and timelines.

The Baltic Dry Index (BDI), a key measure of global freight shipping costs, posted its seventh straight loss – pushing the index below 2,000 points, having fallen +40% since its peak in May and retraced the entire post-pandemic surge. The Baltic Dry Index tracks the average prices paid to transport dry bulk commodities and materials across 20-plus routes.

The number of door-to-door shipping days from China to the United States peaked at 83 days in January 2022, while the latest tick was an average 61 days in July. This metric is down sequentially each month in 2022, although still well above the 45 days it needed to transport goods in February 2020. Sourced from Freightos, this metric tracks the number of days it takes for a good to reach final destination (on average) once an order is placed and accepted.

Truck transportation employee count is back above pre-pandemic highs – +3.6% higher – with YoY growth averaging ~4.6% over the past six months. This measurement captures capacity and utilization of moving physical goods on land.

The number of anchored container ships waiting to offload its cargo at ports on the West Coast has declined substantially from the highs in December 2021 and January 2022, while the East Coast continues to suffer high levels of congestion. The West Coast container ship backlog tracks the number of container ships waiting within 40 miles off the coast to dock at the ports of Los Angeles and Long Beach, while the East Coast container ship backlog estimates the number of container ships waiting within 140 miles to dock at the East and Gulf Coast ports.

Source: Goldman Sachs Research, New York Fed, Longview Economics
2-year Treasury yields surge to highest level since 2007
2-year Treasury note yields are at the highest level since 2007, approaching 3.50%. Back then, a series of interest rate hikes by the Fed, which brought the Fed Funds Rate from 1.00% to 5.25%, were put in place to dampen rising real estate prices. Amidst the ensuing trouble with lenders and credit markets, the Fed then began to reduce interest rates in 2007. Many investors thought the Fed's easing campaign would solve the overheating real estate market without major ramificiations. Few appreciated the magnitude of the debt excesses built over the previous five years, as well as the ballooning subprime lending market, but most importantly the fact that it can take six to twelve months (or longer) before the effects of higher yields truly run its course through the system. Monetary policy effects work with a lag, which is often why it’s so difficult to implement with precision.

Fast forward to the current moment where 2-year yields were ~0.75% to start 2022. Now, those yields are higher by almost 2.75%. The associated economic effects of higher yields are just beginning to be felt – the so-called tightening of financial conditions – which we can measure through mortgage rates, new issues in the corporate bond market, commodity prices, etc. The problem we potentially face is the Federal Reserve is determined to keep fighting inflation despite not precisely knowing how prior rate hikes will weigh on the future economy. As such, the market doesn't believe the Fed will forsake the economy to fight inflation. Only time will tell if the Federal Reserve’s rhetoric and interest rate policy decisions will lead to a soft landing, or something much worse. Today, however, the Fed is steadfast in their commitment to end four-decade high inflation.
Source: YCharts, Lance Roberts
Zumper national rent report
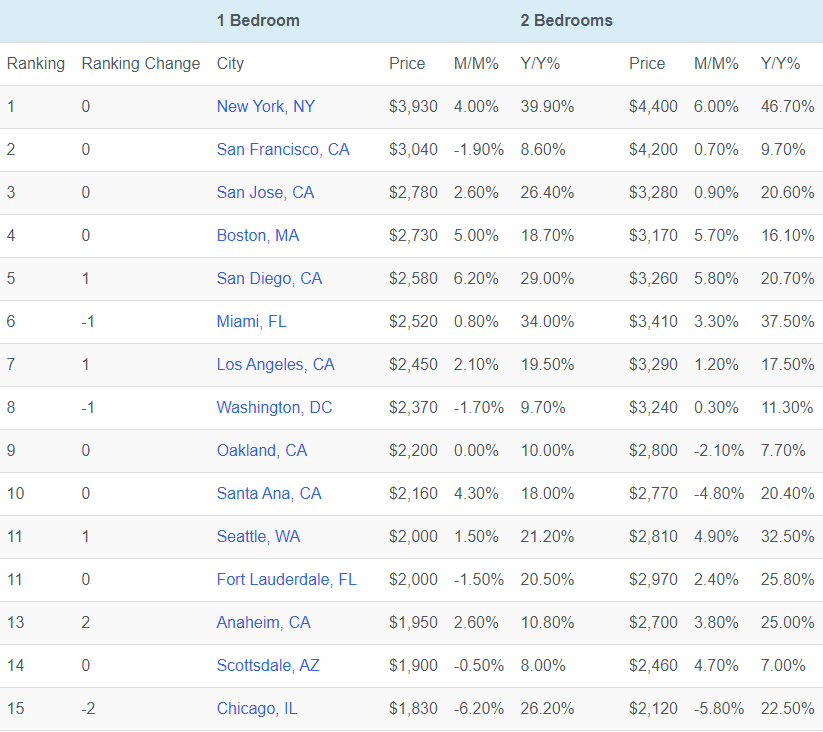
It’s not getting any easier for renters. The Zumper National Rent Index hit another record with the median monthly price for a newly listed one-bedroom apartment climbing +11.8% YoY to $1,486 from a year ago. Rising interest rates are partly behind the trend, making home purchases more expensive to finance, according to Zumper Inc. Chief Executive Officer Anthemos Georgiades. “Many would-be buyers are opting out of the market, creating additional demand for rentals,” the report said.

More than half of U.S. cities are showing double-digit rent hikes, with some over 30%. New York City continues to be the priciest place to be a tenant, with median one-bedroom rent of $3,930 up +39.9% YoY. Other major metropolitan areas dominate the top 15 cities on the list.
This difficult rental market is creating a major unaffordability problem, and it’s forcing many prospective renters to reconsider shared living spaces with roommates, opt out of traditional 12 month leases, or sacrifice on location, size, and/or amenities.
Source: Zumper Inc., Bloomberg
Norway displaces Russia as Europe’s biggest NatGas supplier
The European Union is undertaking proactive and aggressive measures in reducing its dependence on Russian natural gas and has made some initial progress. Norway has displaced Russia as the top supplier of NatGas to the EU as energy supply chains are reformed in real time.
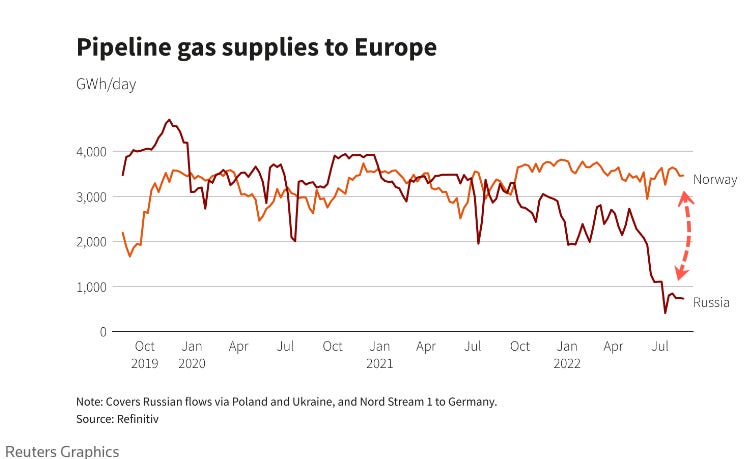
Moscow has reduced NatGas flows to EU countries via the Nord Stream 1 pipeline to just 20%, and tomorrow Russian state-owned energy exporter Gazprom PJSC said it would shut down the NatGas pipeline to Germany for three days of maintenance. These recent developments have throttled electricity prices in the region and forced the European Union to impose extreme measures to lower its NatGas usage until March 2023.
Russia typically supplies ~40% of Europe's NatGas. The large supply gap created by sanctions against Russia has enabled other countries to fill the void – namely Norway, which is on track to lift its production of Natural Gas by 8% to produce some 122 billion cubic metres of gas in 2022 and could set a new high watermark in production levels. "I expect that we can maintain the production levels we are at now until 2030," Norway's energy minister Terje Aasland said.

Source: Reuters
That’s all for today.
Blake
Welcome to The Sandbox Daily, a daily curation of relevant research at the intersection of markets, economics, and lifestyle. We are committed to delivering high-quality and timely content to help investors make sense of capital markets.
Blake Millard is the Director of Investments at Sandbox Financial Partners, a Registered Investment Advisor. All opinions expressed here are solely his opinion and do not express or reflect the opinion of Sandbox Financial Partners. This Substack channel is for informational purposes only and should not be construed as investment advice. Clients of Sandbox Financial Partners may maintain positions in the markets, indexes, corporations, and/or securities discussed within The Sandbox Daily.