The Sandbox Daily (8.31.2022)
The Buffett Indicator, Euro-zone inflation, Bitcoin vs. M2 money supply, consumer confidence, and Mickey Mantle
Welcome, Sandbox friends.
Today’s Daily discusses the Buffett Indicator to reflect on the current stock market’s valuation relative to history, Euro-zone inflation hitting another record high, comparing the supply of bitcoin to the United States money supply, a strong rebound in consumer confidence, and a Mickey Mantle rookie baseball card.
Let’s dig in.
EQUITIES: Nasdaq 100 -0.57% | Russell 2000 -0.62% | S&P 500 -0.78% | Dow -0.88%
FIXED INCOME: Barclays Agg Bond -0.47% | High Yield -0.55% | 2yr UST 3.499% | 10yr UST 3.201%
COMMODITIES: Brent Crude -5.09% to $94.96/barrel. Gold -0.84% to $1,719.7/oz.
BITCOIN: +1.20% to $20,119
US DOLLAR INDEX: +0.14% to 108.848
CBOE EQUITY PUT/CALL RATIO: 0.80
VIX: -1.30% to 25.87
The Buffett indicator
Total stock market capitalization to Gross Domestic Product (GDP) – the ratio of all publicly traded corporate equities to our country’s output of goods and services – is a long-term valuation indicator of the U.S. stock market that has come to colloquially be called the “Warren Buffett Indicator” due to comments made to Fortune Magazine back in 2001 when Uncle Warren said it was “the best single measure of where valuations stand at any given moment.”
So, where are we now given the repricing of risk assets in 2022? The indicator currently sits at 168% which is down from the peak of the equity markets in November 2021 (201%) but firmly higher than the pre-COVID highs (155%), pre-GFC highs (106%), and pre-DotCom bubble (140%), and the average going back to 1995 (109%). So, the stock market valuation has reset from the peak exuberance of the recent highs but still comes in rich versus historical analogs.
Source: Chartr
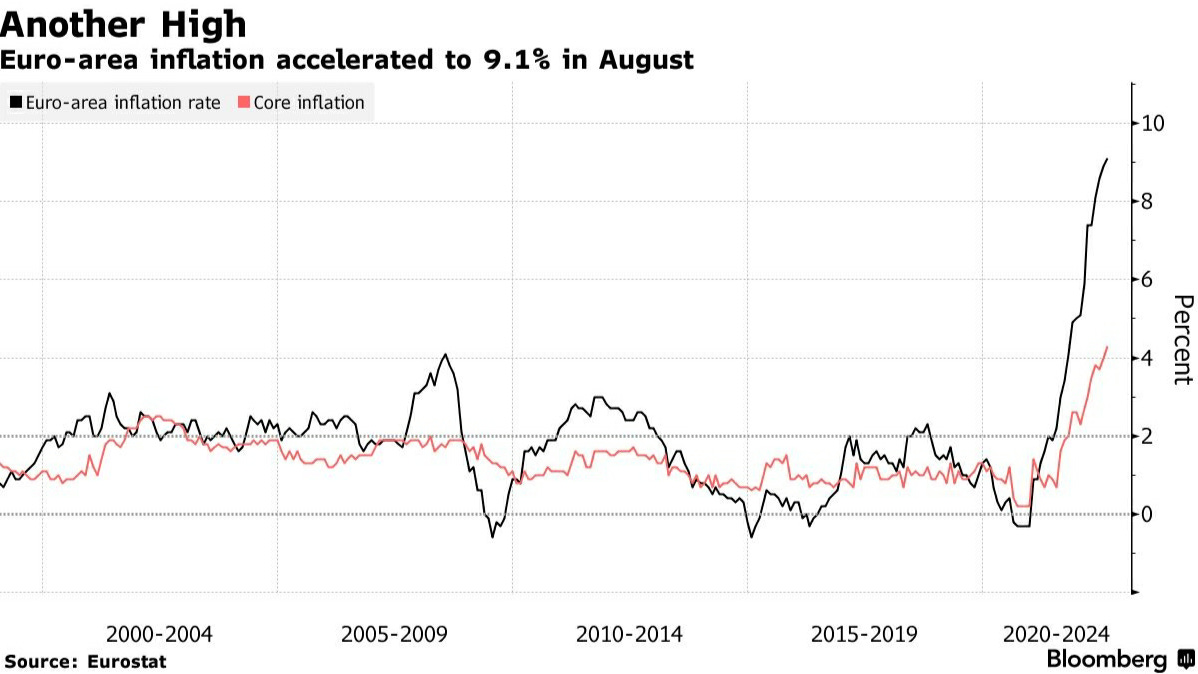
Euro-zone inflation hits record high as European Central Bank weighs jumbo-sized interest rate hike
Euro-area inflation accelerated to another all-time high, strengthening the case for the European Central Bank to consider a jumbo-sized interest rate hike when it convenes next week. Consumer prices in the 19-nation currency bloc jumped +9.1% YoY in August, beating the +9% median estimate in a Bloomberg survey of economists, and the headline print was led by energy and food. The market probability now favors a 75 basis point ECB hike at the upcoming meeting.
Like most matters related to the Euro-zone, central bank chiefs around the region have differing views on the corrective measures of monetary policy to enact due to differences unique to each country – disparate post-COVID economic recoveries, varying energy shocks from the Russia-Ukraine conflict, and inflationary pressures.
Source: Bloomberg
Bitcoin supply vs. M2 money supply
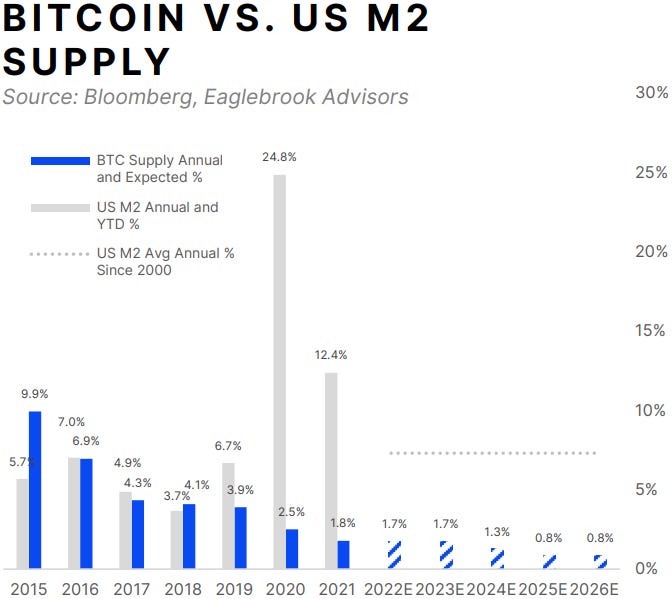
Cryptocurrency enthusiasts often point to supply as an influential driver of bitcoin’s perceived value. After all, money supply – and more importantly, the change in money supply – has critical implications for domestic economies regarding interest rates, monetary and fiscal policy, inflation, and global trade to name a few.
Understanding the significance of bitcoin’s hard-coded, fixed supply structure in relation to the U.S. M2 money supply – which includes cash, checking, savings, money-market, and other time deposits – can illustrate a key driver of value creation in the cryptocurrency. Bitcoin’s circulating supply is driven by the “halving” cycle, a scheduled and immutable 50% reduction in new issuance every four years and, ultimately, the entire supply is fixed at 21,000,000 bitcoin. Conversely, the United States M2 money supply is driven by governmental bodies and oversight, and the supply is moderated by central bank policy, including but not limited to contractionary and expansionary monetary and fiscal policy, adjusting interest rates, and large banking institution’s reserve ratios.
Since the beginning of 2020, U.S. M2 money supply has risen +41.7%, while bitcoin’s supply has risen just 5.5%.
Source: Eaglebrook Advisors
Consumer confidence rebounds
The Conference Board’s Consumer Confidence Index rebounded above consensus to 103.2 in August – it was its first increase in four months. Consumer confidence increased across all demographic and income categories. On net, consumers still expect business conditions and job availability to worsen over the next six months, but the outlook was less negative than in recent months. While the level is well below its cycle peak in mid-2021, it remains consistent with continued economic expansion.
On a YoY basis, confidence is off 12.0 points, but momentum has improved over the past couple of months, a sign of receding recessionary fears.
Consumer confidence has taken a hit this year amid a shaky market outlook and the highest inflation in a generation, which has led the Federal Reserve to pursue aggressive interest rate hikes.
Source: Ned Davis Research
1952 Mickey Mantle rookie baseball card sells for record $12.6 million
A rare 1952 Mickey Mantle baseball card in mint condition, graded 9.5 by SGC, was sold for $12.6 million by Heritage Auctions – a sports memorabilia record. The card – from Mickey’s rookie season – was purchased in 1991 for $50,000.
The sports collectibles space always had a niche following through the years, however it truly exploded in popularity during the pandemic. In 2018, the size of the market was estimated to be ~$5-6 million; by 2021, it grew to ~$25 billion. This auction sale represents the first ever eight-figure baseball trading card, shattering the record $7.25 million paid in a private sale for a T206 Pittsburgh Pirates legend Honus Wagner earlier this year; it also easily trumps the $9.3 million Argentine football player Diego Maradona jersey as the most expensive piece of sports memorabilia ever sold.
Putting this 1952 Mantle card in perspective, Mickey made a league-high $75,000 in 1961, equivalent to ~$680,000 in today’s dollars.
Source: The Action Network, Bloomberg
That’s all for today.
Blake
Welcome to The Sandbox Daily, a daily curation of relevant research at the intersection of markets, economics, and lifestyle. We are committed to delivering high-quality and timely content to help investors make sense of capital markets.
Blake Millard is the Director of Investments at Sandbox Financial Partners, a Registered Investment Advisor. All opinions expressed here are solely his opinion and do not express or reflect the opinion of Sandbox Financial Partners. This Substack channel is for informational purposes only and should not be construed as investment advice. Clients of Sandbox Financial Partners may maintain positions in the markets, indexes, corporations, and/or securities discussed within The Sandbox Daily.


