

The Sandbox Daily (8.3.2022)
The Baltic Dry Index, collapsing VIX, consumer debt delinguencies rise, 10-yr UST spike, and M2 Money Supply contracting

Welcome, Sandbox friends.
Today’s Daily discusses the rapidly plummeting freight shipping costs as measured by the Baltic Dry Index, the recent collapse in the CBOE Market Volatility Index (VIX), consumer debt delinquencies on the rise, yesterday’s spike in the 10-year U.S. Treasury rate, and the slowdown in the M2 Money Supply.
Let’s dig in.
EQUITIES: Nasdaq 100 +2.73% | S&P 500 +1.56% | Russell 2000 +1.41% | Dow +1.29%
FIXED INCOME: Barclays Agg Bond +0.48% | High Yield +0.68% | 2yr UST 3.088% | 10yr UST 2.712%
COMMODITIES: Crude Oil -2.42% to $99.71/barrel. Gold +0.34% to $1,782.6/oz.
BITCOIN: +0.99% to $23,032
VIX: -8.27% to 21.95
CBOE EQUITY PUT/CALL RATIO: 0.56
US DOLLAR INDEX: -0.13% to 106.369
Shipping costs falling at incredibly rapid rate
The Baltic Dry Index (BDI), a key measure of global freight shipping costs, posted its seventh straight loss and represents its longest losing streak in roughly four months – pushing the index below 2,000 points, having fallen +40% since its peak in May and retraced the entire post-pandemic surge. The Baltic Dry Index tracks the average prices paid to transport dry bulk commodities and materials across 20-plus routes; it does not track the tankers moving oil and natural gas around the world.
Shipping rates soared during 2021 as a strong recovery from the pandemic caused demand to significantly outstrip supply, but the BDI is now back at its long-run mean as supply disruptions continue to ease and ISM new orders show softening demand. The BDI is often viewed as a reliable leading indicator of future global economic activity because changes in the index reflect supply and demand for important input materials used in manufacturing. This reversal in freight shipping costs also suggest goods inflation is moderating, meaning less inflation in the pipeline for upcoming CPI and PPI prints.

Source: Longview Economics
VIX collapsing while equities exude strength and continued follow through from the mid-June lows
The 10-day moving average for the S&P 500 Volatility Index (VIX) continues to decline in lockstep as the major US equity indices (S&P 500 and Nasdaq 100) rally meaningfully off the mid-June lows. Bulls would welcome continued lower readings in the VIX index after a difficult and volatile year in markets, however near-term technical momentum indicators and overhead supply suggest we are likely entering a period where stocks stall out and consolidate before resolving in direction or the other.

Source: Potomac Fund Management
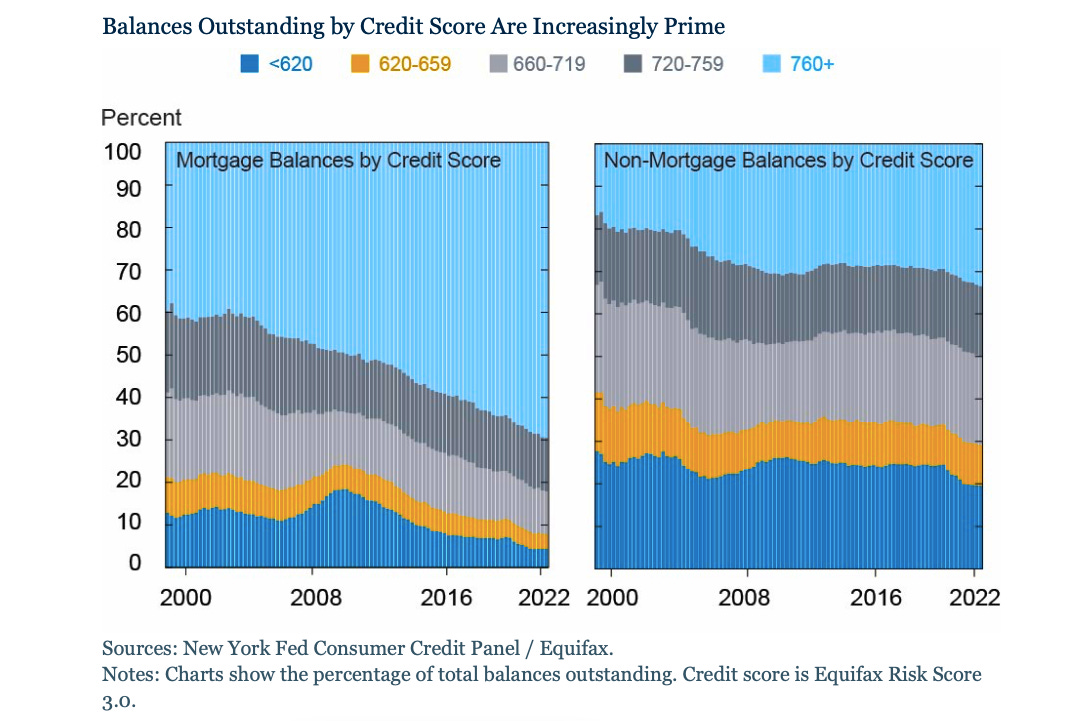
Consumer debt delinquencies are rising
According to the Quarterly Report on Household Debt and Credit from the New York Fed’s Center for Microeconomic Data, the rate at which mortgage, auto loan, credit card, and other debts went into delinquency increased by 0.5 percentage points during the 2nd quarter of 2022. The uptick in delinquencies is notable but not alarming – perhaps gravitating back to a level that’s suitable for a normal economy and levels last seen pre-pandemic. “With the supportive policies of the pandemic mostly in the past, there are pockets of borrowers who are beginning to show some distress on their debt,“ New York Fed researchers observed on Tuesday.

The report rebuts any immediate concerns by showing households are in much better position to manage their debt obligations, as reflected by low debt service ratios, as well as a growing share of debt being issued to borrowers with higher credit scores due to better lender underwriting standards.
Source: Sam Ro (TKer), Liberty Street Economics
Treasury spike
Yesterday's rise in the 10-year Treasury yield was one of the largest in the last five years – the other spikes of similar magnitude were two days at the height of the Covid lockdown and the Monday in June when the Federal Reserve’s intention to hike the Federal Funds rate by 75bps was leaked to the Wall Street Journal. Due to growth concerns, inflationary fears, and policy tightening, the movement in interest rates during 2022 will be one of the lasting themes that sets this year apart from others.

Source: John Authers, Bloomberg
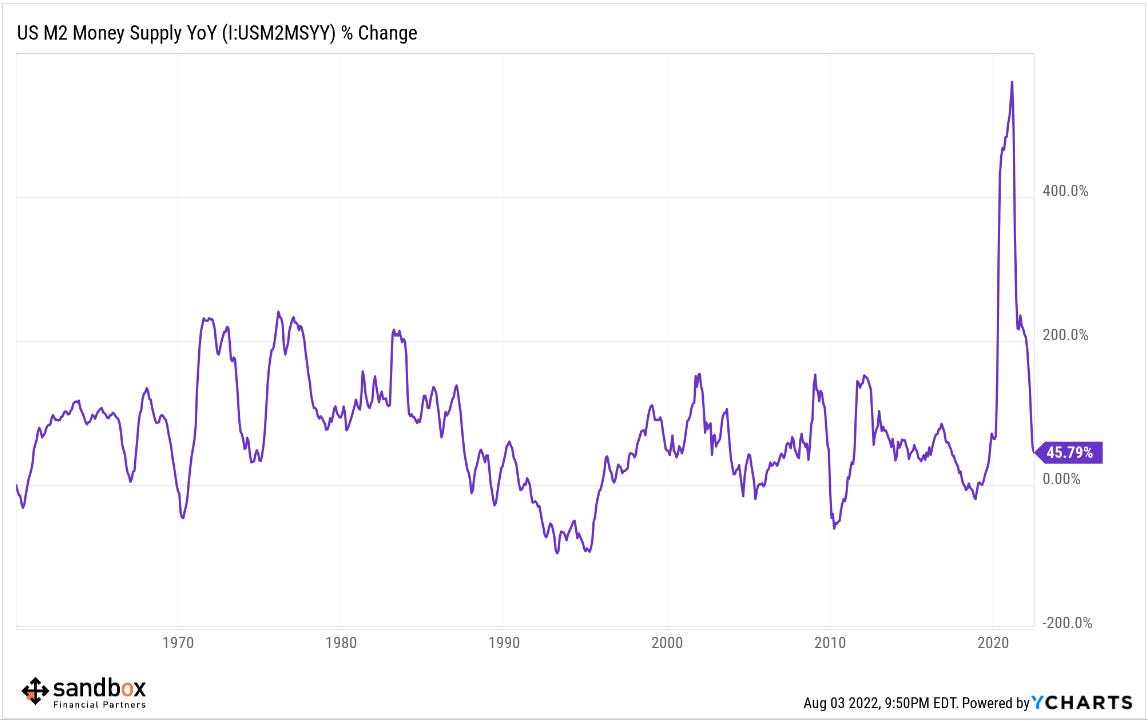
M2 Money Supply down sharply on a year-over-year basis
Money Supply growth is falling rapidly. Two of the last three months have seen a decrease in the monthly seasonally-adjusted YoY M2 Money Supply, with the recent month dropping $17B. Given that April was the first contraction in 12 years, two of the last three months showing a contraction is an telling sign and shows the Federal Reserve’s tightening of financial conditions is taking hold.
The M2 Money Supply, also referred to as “M2 Money Stock,” is a measure of the amount of currency in circulation. It includes M1 money, which is physical cash and deposits, in addition to M2 money that is “less liquid,” such as bank savings deposits, time deposits, and money market mutual funds. Historically, when the money supply dramatically increased (decreased) in global economies, there would be a follow-on dramatic increase (decrease) in the prices of goods and services.
Source: Sandbox Financial Partners
That’s all for today.
Blake
Welcome to The Sandbox Daily, a daily curation of relevant research at the intersection of markets, economics, and lifestyle. We are committed to delivering high-quality and timely content to help investors make sense of capital markets.
Blake Millard is the Director of Investments at Sandbox Financial Partners, a Registered Investment Advisor. All opinions expressed here are solely his opinion and do not express or reflect the opinion of Sandbox Financial Partners. This Substack channel is for informational purposes only and should not be construed as investment advice. Clients of Sandbox Financial Partners may maintain positions in the markets, indexes, corporations, and/or securities discussed within The Sandbox Daily.