The Sandbox Daily (9.1.2022)
60-40 portfolio, 2Q22 earnings wrap-up, inflation categories, S&P 500 technicals, and Sam's Club
Welcome, Sandbox friends.
Today’s Daily discusses the rough year for the 60-40 portfolio, reviewing trends from the 2nd quarter corporate earnings season, unpacking inflation by its sub-components, S&P 500 market internals breaking down from the summer rally, and Sam’s Club membership fee.
Let’s dig in.
EQUITIES: Dow +0.46% | S&P 500 +0.30% | Nasdaq 100 +0.02% | Russell 2000 -1.15%
FIXED INCOME: Barclays Agg Bond -0.48% | High Yield +0.26% | 2yr UST 3.518% | 10yr UST 3.259%
COMMODITIES: Brent Crude -3.75% to $92.08/barrel. Gold -1.04% to $1,708.2/oz.
BITCOIN: -0.66% to $20,069
US DOLLAR INDEX: +0.88% to 109.659
CBOE EQUITY PUT/CALL RATIO: 0.78
VIX: -1.20% to 25.56
Tough going for 60-40
They say a picture is worth a thousand words. Well, here we’re looking at the worst calendar years for a U.S. 60-40 portfolio through the month of August going back to 1976 (historical data limited by the inception of the Bloomberg US Aggregate Bond Index)...
One of the many wonderful benefits of holding some allocation to fixed income in an investor’s portfolio is to safeguard risk – namely, when stocks are cooling off, bonds will help carry the load. After all, while bonds may never produce home runs, they will provide steady singles along the way through 1) a stream of income and 2) benefits of low correlation. This stability from fixed income helps mitigate downside risk to portfolio returns. However, here in 2022, we find that bonds have not served their traditional role well because of the interest rate hiking cycle putting pressure on bond prices. To wit, this is the longest U.S. bond market drawdown in history (25 months and counting) and the largest (-12.3%) since 1980.
Wrapping up 2nd quarter earning season
Better-than-feared.
2nd quarter corporate earnings season can best be described as such. Given the uncertain macro backdrop and concerns around short-term economic and corporate earnings growth, this recent earnings cycle had its fair share of highs, lows, surprises, and everything in between. FactSet kindly summarized the most interesting developments and trends that emerged over the last quarter into this wonderful infographic. Enjoy!
Source: FactSet
Unpacking inflation by category
The Fed's numerous interest rate hikes – 2.25% thus far in 2022 – are showing some early signs in slowing the economy – and, more importantly, inflation. Fundstrat put together this data table showing that many inflation components are “starting to fall like a rock...”
Unfortunately, context is everything. Many of these categories are much smaller inputs in the Consumer Price Index (CPI) basket calculation – all told, these 50 components only add up to 18.75% of the CPI basket.
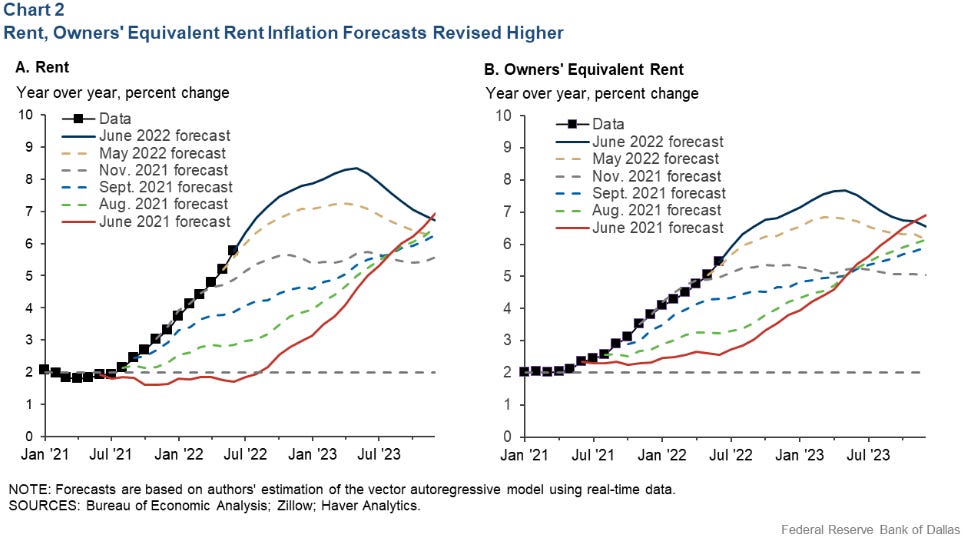
Larger, more meaningful inputs such as the Shelter category (32.06%), which includes both Owner’s Equivalent Rent (OER) and Rent of Primary Residence, remain elevated at +5.7% growth YoY and represent the stickier sides of inflation because housing prices feed into the CPI and PCE rent measures with a lag by roughly 1-1.5 years due to the long-dated nature of rental contracts.
The Federal Reserve Bank of Dallas released its own report suggesting the Shelter category likely won’t moderate until mid-2023.
Source: Fundstrat, Bloomberg, Bureau of Labor Statistics, Federal Reserve Bank of Dallas
Market internals breaking down from summer rally
Breadth metrics continued to weaken across the major U.S. markets over the past week. The S&P 500 Advance/Decline Line has seen a large pullback to test its rising 50-day moving average, while the percentage of S&P 500 stocks trading above their 200-DMA, 50-DMA, and 20-DMA are falling rather quickly. And if we broaden out our universe to include all issues trading on the New York Stock Exchange, we have more stocks making new lows than new highs. So, while short-term trend metrics are nearing washed-out levels, it’s still difficult to make a compelling case for aggressive bullishness in this environment.
Source: Potomac Fund Management
Sam’s Club raises prices
Walmart-owned Sam’s Club is raising its annual membership fees on October 17th – to $50 (from $45) for club members and $110 (from $100) for members of its higher-tier level, “Plus.” It marks the first fee hike in nine years for the entry-level membership. That brings the price of Sam’s Club closer to rival Costco, which charges $60 a year for its basic membership and $120 for its higher-tier “Gold” membership.
Source: CNBC
That’s all for today.
Blake
Welcome to The Sandbox Daily, a daily curation of relevant research at the intersection of markets, economics, and lifestyle. We are committed to delivering high-quality and timely content to help investors make sense of capital markets.
Blake Millard is the Director of Investments at Sandbox Financial Partners, a Registered Investment Advisor. All opinions expressed here are solely his opinion and do not express or reflect the opinion of Sandbox Financial Partners. This Substack channel is for informational purposes only and should not be construed as investment advice. Clients of Sandbox Financial Partners may maintain positions in the markets, indexes, corporations, and/or securities discussed within The Sandbox Daily.


