

The Sandbox Daily (9.26.2022)
Interest rate hikes, investor protection, sentiment, IPO market

Welcome, Sandbox friends.
Today’s Daily discusses the historic rate hikes disrupting markets, investors seeking protection at historic levels, sentiment is completely washed out, and the IPO market has collapsed.
Let’s dig in.
Markets in review
EQUITIES: Nasdaq 100 -0.51% | S&P 500 -1.03% | Dow -1.11% | Russell 2000 -1.41%
FIXED INCOME: Barclays Agg Bond -1.29% | High Yield -1.18% | 2yr UST 4.345% | 10yr UST 3.928%
COMMODITIES: Brent Crude -2.55% to $83.95/barrel. Gold -1.34% to $1,633.4/oz.
BITCOIN: +5.05% to $19,824
US DOLLAR INDEX: +0.82% to 114.121
CBOE EQUITY PUT/CALL RATIO: 1.02
VIX: +7.82% to 32.26
Historic rate hikes disrupt markets
The Fed is inflicting real pain on the stock, bond, and mortgage markets as it raises interest rates in its fight against persistently high inflation. Last week, the Federal Reserve signed off on its third consecutive three-quarter point rate hike (0.75%), lifting its target benchmark federal funds rate to a range of 3.00 – 3.25%.
The speed and magnitude of this rate hiking cycle is an unprecedented pace when viewing modern monetary policy history, signaling the Fed's strong resolve to stomp out rising prices. No other hiking cycle has started this steeply since the Fed started targeting the Effective Funds Rate in the 1980s. The early results are profound: the 10-year U.S. Treasury is back above 4% for the first time since 2007, the average 30-year fixed-rate mortgage hit 6.29% last week, the S&P 500 is down -23.31% year-to-date, and Bitcoin is down -59.40% YTD.
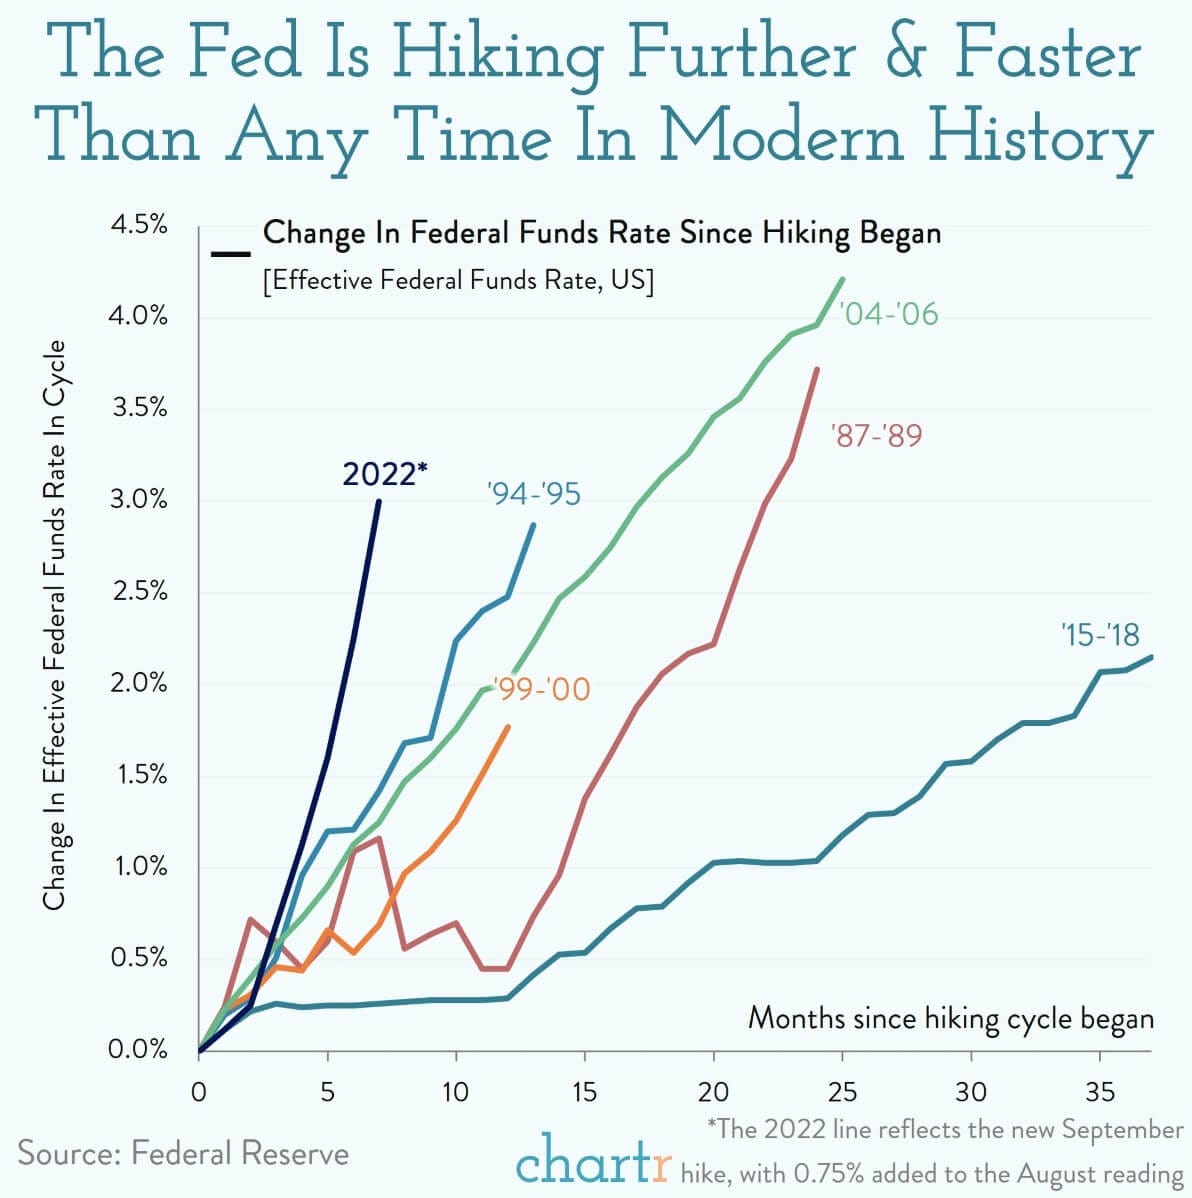
Source: Chartr
Investors seek protection
The CBOE equity put/call ratio, a measure of the amount of bearish option market bets to bullish ones traded daily on the Chicago Board Options Exchange, is climbing higher in a sign of growing angst among investors. With demand for bullish and long exposure dwindling, investors are seeking downside protection in the face of sticky high inflation around the globe, hawkish central banks, a war in Ukraine, and economic uncertainty. The CBOE equity put/call ratio above 1.0 is a fairly unique reading in its data series and was last triggered at the depths of the pandemic market selloff.

“They’re buying protection against a crash at a pace unlike anything the market has ever seen,” said Jason Goepfert, chief research officer at Sundial. “The sudden and massive hedging activity of some of the market’s largest traders is unsettling.”
Retail traders spent $18 billion buying put option protection last week, a record. They’re holding $46 billion worth of index futures net short, also a record.

And it's not just individual investors engaging in this behavior. We saw similar activity earlier in September in which a burst in buying insurance at the institutional level triggered a truly historic reading, when institutional traders bought $8.1 billion worth of put options and less than just $1 billion in calls – a move on par with the extreme readings witnessed in 2008.

Source: Sandbox Financial Partners, SentimenTrader
Investor sentiment shows a washout
The American Association of Individual Investors (AAII) weekly survey showed a spike in bearishness to more than double its historical average. In fact, this is one of only four times in the 35-year history of the survey that bears have exceeded 60%, which has been a powerful bullish signal; one-year forward returns after the others: +22.4%, +31.5%, +7.4%, and +56.9%.

And when looking at the net reading on the survey (bullish – bearish sentiment), the current reading of -43.2% is the 4th worst reading in its history and 6-month and 12-month prospective returns become quite attractive. In fact, 89% of the outcomes are positive for 6-month and 12-month forward returns on the S&P 500 when reviewing the 23 worst AAII readings.

Source: Fundstrat, American Association of Individual Investors
IPO market collapses
Investors faced with high inflation and rising interest rates have ditched high-flying growth stocks and unprofitable ventures, instead increasing their exposures to safer, more proven and profitable alternatives. U.S.-listed companies raised over $155 billion in proceeds in 2021 through their initial public offerings (which excludes special purpose acquisition companies, or SPACs, according to data from EY and Dealogic. In the first half of 2022, they only raised $4.8 billion.

The poor performance of recent public companies is another contributing force to the deep freeze in the IPO market. Roughly 87% of companies that went public in the U.S. last year are trading below their offering prices, down more than 49% on average as of Friday’s close, according to Dealogic. By rough comparison, the S&P 500 is down 23% this year, while the tech-heavy Nasdaq Composite has fallen 31%.

Some companies, such as Klarna, are being forced to raise money privately, at significantly lower valuations. Others are choosing to be acquired instead, such as collaboration-software company Figma, which sealed a $20 billion deal with Adobe Inc. The slowdown is also hurting major banks where Goldman Sachs, Morgan Stanley, and JPMorgan Chase, the three leading IPO underwriters, all reported sharply lower investment banking revenues in the 2nd quarter.
Source: Wall Street Journal, CNBC, EY
That’s all for today.
Blake
Welcome to The Sandbox Daily, a daily curation of relevant research at the intersection of markets, economics, and lifestyle. We are committed to delivering high-quality and timely content to help investors make sense of capital markets.
Blake Millard is the Director of Investments at Sandbox Financial Partners, a Registered Investment Advisor. All opinions expressed here are solely his opinion and do not express or reflect the opinion of Sandbox Financial Partners. This Substack channel is for informational purposes only and should not be construed as investment advice. Clients of Sandbox Financial Partners may maintain positions in the markets, indexes, corporations, and/or securities discussed within The Sandbox Daily.