

The Sandbox Daily (9.28.2022)
U.S. dollar, housing market, buying the dip, carnage in stocks, and energy production

Welcome, Sandbox friends.
Today’s Daily discusses the U.S. dollar strength weighing on markets around the world, U.S. housing prices falling for the first time in a decade, struggling dip buyers, the carnage in U.S. stocks, and reviewing global energy production.
Let’s dig in.
Markets in review
EQUITIES: Russell 2000 +3.17% | Nasdaq 100 +1.97% | S&P 500 +1.97% | Dow +1.88%
FIXED INCOME: Barclays Agg Bond +1.58% | High Yield +1.79% | 2yr UST 4.139% | 10yr UST 3.739%
COMMODITIES: Brent Crude +3.58% to $88.74/barrel. Gold +1.67% to $1,663.7/oz.
BITCOIN: +1.48% to $19,481
US DOLLAR INDEX: -1.29% to 113.112
CBOE EQUITY PUT/CALL RATIO: 0.78
VIX: -7.42% to 30.18
Dollar strength weighs heavy on markets
A strong U.S. dollar has not been kind to markets in 2022.
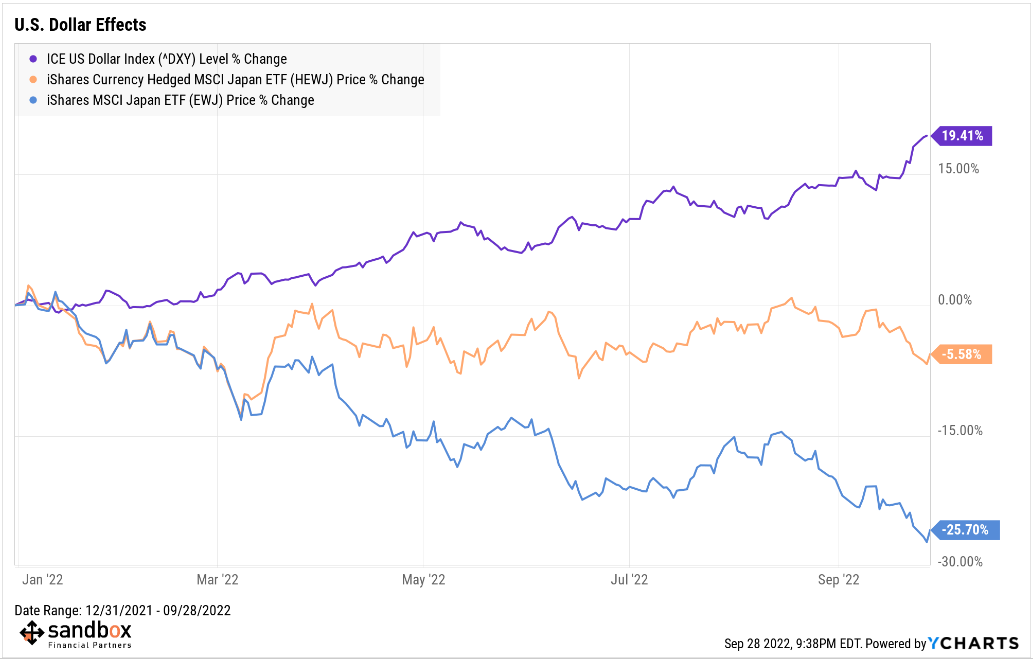
What is the dollar doing these days? It’s been strong all year and yet recently went parabolic, breaking out of a long base dating back to early 2015. In fact, the U.S. dollar index is up +19.41% year-to-date. Rising interest rates and safe haven status will do that.

If we’re considering risk assets, let’s review recent market history. Using Bitcoin as a proxy for risk appetite, take a look at Bitcoin’s market price action versus the U.S. dollar. When the dollar is doing well, risk assets (stocks, crypto, etc.) are suffering. And when the dollar is weakening, risk assets are gaining strength.

Now consider sleepy currency markets. The U.S. dollar is up +22% over the last year while other foreign currencies have seen their respective value depreciate over the same time frame. Thinking about travelling abroad?!?!

Clearly, the dollar is gaining strength versus currencies all over the world. No better way to capture this divergence than using Japan’s equity markets – ceteris paribus. Using BlackRock ETFs as proxies, the dollar-hedged “HEWJ” versus the pure-play Japanese exposure “EWJ” clearly demonstrates the impact that a strong dollar is having on markets around the world. HEWJ and EWJ are demonstrably the same thing, yet the delta in their respective returns since January 1st is 20.12% !! The dollar is wreaking havoc.
In this cycle, the strong negative correlation between risk/all assets and the U.S. Dollar has been the driver here. Without a weaker dollar, it’s going to be hard for a new bull market to emerge.
Source: Sandbox Financial Partners, All Star Charts
US housing prices fall for the first time since 2012
For the first time in a decade, home prices in the United States are falling. A national measure of prices in 20 large cities fell -0.44% in July, the first drop since March 2012 and ending 123 consecutive monthly increases, per a report yesterday from the S&P CoreLogic Case-Shiller index.
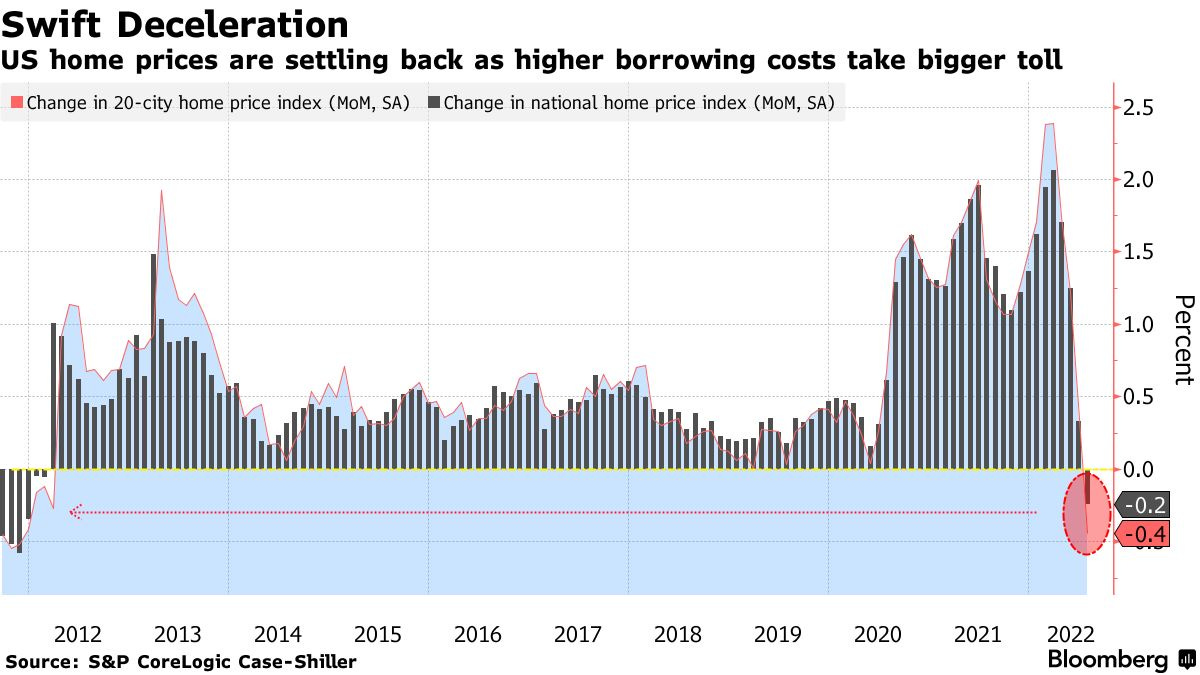
Widening the aperture, prices remain high to be clear. The Case-Shiller national index shows the average home prices has increased +15.8% year-over-year in July. But that was the smallest gain since April 2021, and the slowdown from the +18.1% jump in June was the largest deceleration in the history of the index.

Source: Bloomberg, Calculated Risk
Dip buying is not working
It is the worst year for buying the stock market dip since the 1930s. The S&P 500 has dropped an average of -1.2% this year in the week after a one-day loss of at least 1%, according to Dow Jones Market Data. Instead of rebounding after a tumble, stocks have continued to fall, burning investors who stepped in to buy shares on temporary sale. This is a far departure from the last 30 years or so, save the major bear markets, when protracted bull markets, falling interest rates, and easy monetary policy fueled eager buyers and speculators to keep buying the dip.

Source: Wall Street Journal
Stock carnage
The average stock in the Russell 3,000 was down -41.7% from its 52-week high as of the close yesterday. That means the average stock would need to rally +71.5% from here to get back to its high.
It's much worse in some sectors, though. As shown below, four sectors have average prices roughly -50% below their 52-week highs. Communication Services is at -51.8%, Consumer Discretionary is at -49.8%, Tech is at -49.4%, and Health Care is at -48.4%. Even Energy stocks are -36.9% below their 52-week highs.

Source: Bespoke Investment Group
40 years of global energy production
Energy consumption was already a hot button topic before 2022, but a war in Ukraine, soaring household energy bills, a shift in American policy, and multi-decade high inflation has brought it to the forefront. So, here's a snapshot of global energy production and the major players that have produced the most fossil fuels, nuclear, and renewable energy since 1980.
While the United States is a dominant player in both oil and natural gas production, China holds the top spot as the world’s largest fossil fuel producer, largely because of its significant production and consumption of coal. Over the last decade, China has used more coal than the rest of the world, combined.

All figures refer to the British thermal unit (BTU), equivalent to the heat required to heat one pound of water by one degree Fahrenheit.
Source: Visual Capitalist
That’s all for today.
Blake
Welcome to The Sandbox Daily, a daily curation of relevant research at the intersection of markets, economics, and lifestyle. We are committed to delivering high-quality and timely content to help investors make sense of capital markets.
Blake Millard is the Director of Investments at Sandbox Financial Partners, a Registered Investment Advisor. All opinions expressed here are solely his opinion and do not express or reflect the opinion of Sandbox Financial Partners. This Substack channel is for informational purposes only and should not be construed as investment advice. Clients of Sandbox Financial Partners may maintain positions in the markets, indexes, corporations, and/or securities discussed within The Sandbox Daily.