The staggering size of the ETF market, plus Energy, financial plans, and S&P 500 forward expectations
The Sandbox Daily (7.11.2023)
Welcome, Sandbox friends.
Today’s Daily discusses:
the staggering size of the ETF market
energy breaking out
2/3rds of Americans don’t have a financial plan
industry analysts expecting more gains over next 12 months
Let’s dig in.
Markets in review
EQUITIES: Russell 2000 +0.96% | Dow +0.93% | S&P 500 +0.67% | Nasdaq 100 +0.49%
FIXED INCOME: Barclays Agg Bond +0.22% | High Yield +0.54% | 2yr UST 4.885% | 10yr UST 3.976%
COMMODITIES: Brent Crude +2.18% to $79.38/barrel. Gold +0.32% to $1,937.2/oz.
BITCOIN: -1.29% to $30,562
US DOLLAR INDEX: -0.29% to 101.679
CBOE EQUITY PUT/CALL RATIO: 0.51
VIX: -1.53% to 14.84
Quote of the day
“Short-term thinking is at the root of most investing problems. If you can focus on the next five years while the average investor is focused on the next five months, you have a powerful edge. Markets reward patience more than any other skill.”
- Morgan Housel, 16 Rules for Investors to Live By
The staggering size of the ETF market
Exchange-traded funds (ETFs) are cost-effective, liquid, and easily accessible methods for achieving market exposure to any investment strategy and style available to investors. The low barrier to entry is what makes this vehicle so popular among the investing public.
This helps explain why that segment of the market has experienced explosive growth over the last 30 years. The sheer size of the institutions providing these investment vehicles is staggering. BlackRock takes top spot at $9.1T, followed by Vanguard at $7.6T.
The SPDR S&P 500 ETF Trust (SPY) is the most popular ETF and has $413.2B in assets under management (AUM). This is almost $85B more assets than the next most popular ETF by BlackRock, IVV. While State Street SPDR Global Advisors may have the most popular ETF, you can see that within the top 50 it is actually Vanguard and BlackRock that have the most individual ETFs by AUM.
Source: Genuine Impact
Energy breaking out
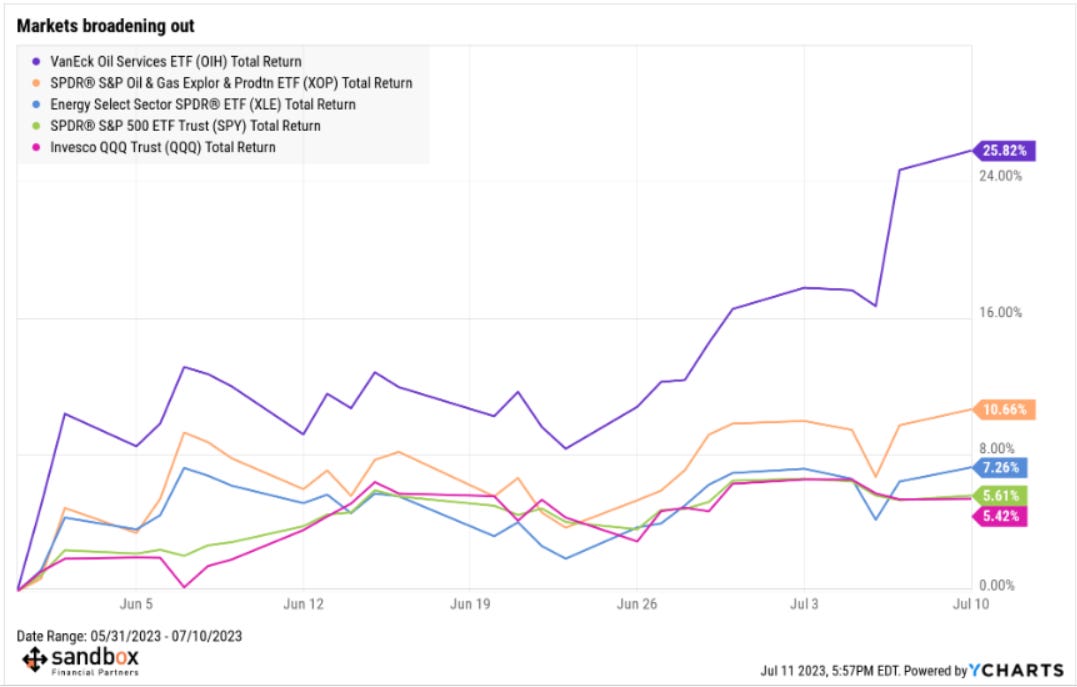
No matter which segment of the energy market you look at, the sector is showing signs of life and recently demonstrating tremendous absolute and relative strength.
After strong 2021 and 2022 calendar years of performance, energy has been the weakest performing sector year-to-date – but over the last 6 weeks, this corner of the market is catching a bid and provides additional evidence that the 2023 bull market is broadening out.
After all, sector rotation is a perfectly symptomatic of bullish behavior.
Looking specifically at Oil & Gas Exploration and Production, price has found support multiple times at the November 2021 highs. As long as this key polarity level holds, the primary uptrend remains intact.
Also notice that price is pushing up against the anchored volume-weighted average price (AVWAP) from last year's highs, making it a critical short-term resistance area.
Should buyers drive a decisive breakout, XOP could revisit its former highs from earlier this year. One would then expect that bullish price action to spillover into the other corners of the energy market and allow for further upside.
Source: All Star Charts
2/3rds of Americans don’t have a financial plan
65% of Americans surveyed in Charles Schwab's 2023 Modern Wealth Survey said they do not have a formal financial plan.
Of those without a plan, 21% said it was because it seemed too complicated and 20% said it was too time consuming.
Source: Charles Schwab
Industry analysts expecting more gains over next 12 months
Having crossed the midpoint of 2023 and with earnings season around the corner, industry analysts are sharpening their pencils about where the market will go from here.
Industry analysts in aggregate predict the S&P 500 will see a price increase of +9.4% over the next 12 months, based on bottom-up target prices and today’s closing index value. The bottom-up target price is calculated by aggregating the median target price estimates (based on company-level estimates submitted by industry analysts) for all the companies in the index; currently, that bottom-up price target is 4,823.78.
Since bottoming at 4,462.27 on November 9, 2022, the bottom-up target price for the S&P 500 has steadily increased by +8.1% to 4,823.78.
At the sector level, the Energy (+23.0%) and Health Care (+15.6%) sectors are expected to see the largest price increases.
Source: FactSet
That’s all for today.
Blake
Welcome to The Sandbox Daily, a daily curation of relevant research at the intersection of markets, economics, and lifestyle. We are committed to delivering high-quality and timely content to help investors make sense of capital markets.
Blake Millard is the Director of Investments at Sandbox Financial Partners, a Registered Investment Advisor. All opinions expressed here are solely his opinion and do not express or reflect the opinion of Sandbox Financial Partners. This Substack channel is for informational purposes only and should not be construed as investment advice. Clients of Sandbox Financial Partners may maintain positions in the markets, indexes, corporations, and/or securities discussed within The Sandbox Daily.


