

The U.S. consumer is seeking value, plus policy ≠ investment results, Mag 7 earnings, and private equity exit activity
The Sandbox Daily (7.22.2024)

Welcome, Sandbox friends.
President Joe Biden becomes the only sitting president since 1968 to withdraw from a presidential race, semiconductor stocks and big tech rebounded fiercely today, and China cuts key short-term rate for the 1st time in a year.
Today’s Daily discusses:
the U.S. consumer is seeking value
careful projecting policy with investment results
Mag 7 driving earnings results
U.S. private equity exit activity
Let’s dig in.
Markets in review
EQUITIES: Russell 2000 +1.66% | Nasdaq 100 +1.54% | S&P 500 +1.08% | Dow +0.32%
FIXED INCOME: Barclays Agg Bond -0.04% | High Yield +0.37% | 2yr UST 4.519% | 10yr UST 4.254%
COMMODITIES: Brent Crude -0.29% to $82.39/barrel. Gold +0.06% to $2,400.6/oz.
BITCOIN: +0.21% to $68,069
US DOLLAR INDEX: -0.07% to 104.320
CBOE EQUITY PUT/CALL RATIO: 0.60
VIX: -9.75% to 14.91
Quote of the day
“You don’t achieve happiness by getting rid of your problems – you achieve it by learning from them.”
- Ray Dalio, Principles
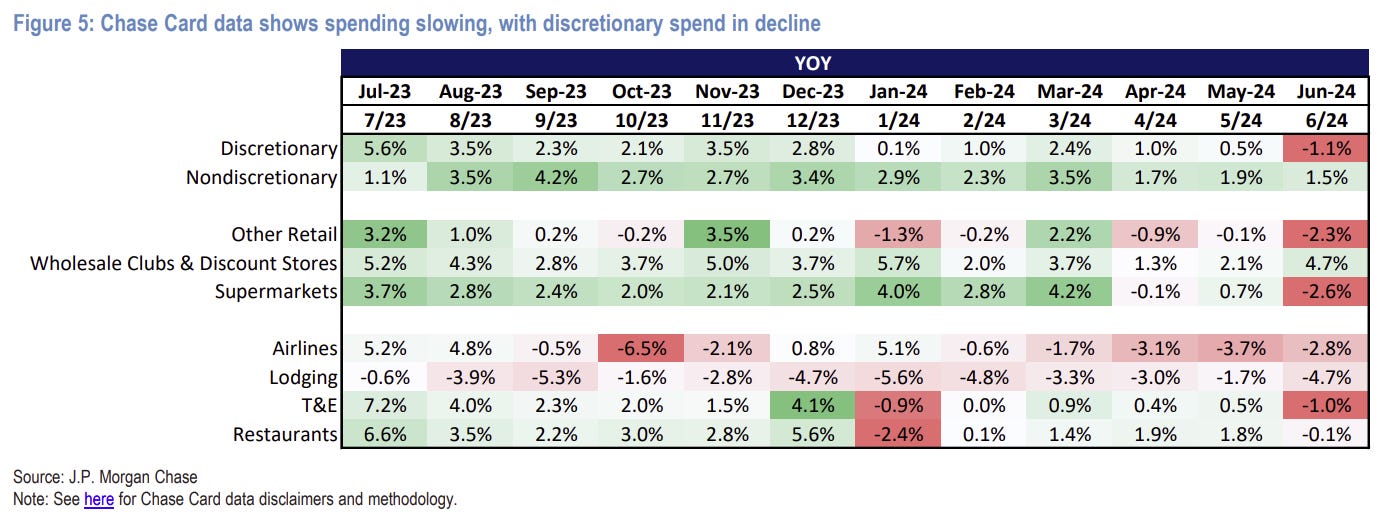
The U.S. consumer is seeking value
The U.S. consumer has held in better than most expected as we work toward a level of “normalcy” post-pandemic.
We should expect that headwinds from inflation, rates, and exhausted COVID surplus savings will temper spending in the back half of 2024 but not drive a full consumer retrenchment.

Chase card data shows we are seeing recent weakness in discretionary spending, with the most dramatic slowing in Lodging, Airlines, Supermarkets, and Other Retail.
Walmart, Costco, and off-price stores are gaining share as consumers trade down from traditional grocery into Walmart for better prices or Costco for value in buying bulk. Apparel and home shoppers are trading down from department stores into Walmart and off price.
The middle-market consumer is making choices in monthly spend but still spending. For example, the family may choose to eat out at a casual dining option like Chili’s (“3 for Me” menu starting at $10.99) and “fund” that by eating out one fewer time that month, or forgoing another discretionary purchase.
Retailers from mass merchants to home centers to the dollar stores, department stores, and specialty all discuss consumer uncertainty and value-seeking behavior. They are spending more of their paychecks on non-discretionary categories, leaving less for discretionary. They are trading down from high-end brands, putting off home projects, and shopping sale events.
This could have a modest impact on 2Q24 margins as retailers increase promotions to drive consumers through the doors.
Source: J.P. Morgan Markets
Careful projecting policy with investment results
Policy is just one driver of leadership trends in the stock market. As we’ve discussed ad nauseum, other factors frequently rise above policy initiatives themselves.
Despite President Joe Biden championing clean energy investment during his 1st term, clean energy stocks have been absolutely crushed under his presidency (chart below, orange line), while they thrived under former President Donald Trump, as low rates, especially post-pandemic, led to a surge by the group.
Conversely, traditional Energy was the worst performer under Trump and has been the best performing sector under Biden (chart below, blue line).

Source: Ned Davis Research
Mag 7 driving earnings results
When certain folks worry about corporate earnings, this next chart encapsulates most of their concerns.
4 of the companies in the “Magnificent 7” – NVIDIA, Amazon, Facebook, and Google – are estimated to be among the top 5 contributors to earnings growth for the S&P 500. Taken together, these companies are expected to grow their earnings 56.4% in Q2. As for the rest of the remaining 496 companies in the index? Just 5.7%.

The size of these Mag 7 companies and their contribution to earnings is artificially inflating heavily skewing EPS growth – past, present, and future.

Bottom line: investors must discern reporting results at the index level because dispersion at the sector and company level are vast.
Source: FactSet
U.S. private equity exit activity
Data from PitchBook shows the dollar value of U.S. Private Equity exits is down -26%, from $209.4B to $155.3B, in the 1st half of 2024 versus the same period last year.
A small yet steady rebound in IPO exits has helped, which likely owes to buoyant public equity markets and an improved outlook for interest rates and the economy on a go forward basis.

That said, the asset class has not emerged from the woods quite yet.
Exits remain far below 2021 levels as public listings remain notably subdued. Moreover, the number of deals in 1H24 rose just +1.3% YoY, while the ratio of PE exits to investments fell to 0.36x in 2Q24 as managers remain focused on putting a near record $4T of dry powder to work.

For public markets, even small improvements in Private Equity exit activity should benefit the Financials sector by way of more robust capital market activity. This is already playing out early in the 2nd quarter earnings season, with many of the money center banks beating earnings expectations thanks to surging investment banking revenues.
However, with interest rates likely to fall slowly rather than drop precipitously, exit activity may take longer to return to normal. As such, opportunities in secondaries, which can provide existing limited partners with liquidity and prospective buyers the chance to invest in seasoned assets at a discount, look increasingly attractive.
Source: PitchBook, S&P Global Market Intelligence
That’s all for today.
Blake
Welcome to The Sandbox Daily, a daily curation of relevant research at the intersection of markets, economics, and lifestyle. We are committed to delivering high-quality and timely content to help investors make sense of capital markets.
Blake Millard is the Director of Investments at Sandbox Financial Partners, a Registered Investment Advisor. All opinions expressed here are solely his opinion and do not express or reflect the opinion of Sandbox Financial Partners. This Substack channel is for informational purposes only and should not be construed as investment advice. The information and opinions provided within should not be taken as specific advice on the merits of any investment decision by the reader. Investors should conduct their own due diligence regarding the prospects of any security discussed herein based on such investors’ own review of publicly available information. Clients of Sandbox Financial Partners may maintain positions in the markets, indexes, corporations, and/or securities discussed within The Sandbox Daily. Any projections, market outlooks, or estimates stated here are forward looking statements and are inherently unreliable; they are based upon certain assumptions and should not be construed to be indicative of the actual events that will occur.