Today's market volatility in context 📉, plus Wall Street rethinking interest rate outlook, VIX explodes 🚀, and Warren Buffett cuts its AAPL stake 🍏
The Sandbox Daily (8.5.2024)
Welcome, Sandbox friends.
Welp, that was quick.
In the U.S, the Dow Jones shed over 1000 points as equity risk – as measured by the Volatility Index, or “VIX” – exploded higher today briefly touching 65. In crypto markets, the action over the weekend was downright ugly as Bitcoin dropped from $65k to $49k. In Japan, the Nikkei just experienced its worst day since 1987, falling more than 12%.
Some additional context and perspective on the market’s biggest headlines and drivers below.
Today’s Daily discusses:
market volatility in context
Wall Street ramps up forecasts on timing, size of interest rate cuts
it’s a bird… it’s a plane… it’s the volatility index ??!?
Warren Buffett cuts Berkshire stake in Apple by half
Let’s dig in.
Markets in review
EQUITIES: Dow -2.60% | Nasdaq 100 -2.96% | S&P 500 -3.00% | Russell 2000 -3.33%
FIXED INCOME: Barclays Agg Bond -0.08% | High Yield -0.62% | 2yr UST 3.898% | 10yr UST 3.778%
COMMODITIES: Brent Crude +0.77% to $77.40/barrel. Gold -0.72% to $2,452.1/oz.
BITCOIN: -6.76% to $55,025
US DOLLAR INDEX: -0.45% to 102.747
CBOE EQUITY PUT/CALL RATIO: 0.81
VIX: +64.90% to 38.57
Quote of the day
“Volatility can prey on investors’ emotions, reducing the probability they’ll do the right thing.”
- Howard Marks, Oaktree Capital Management in Risk Revisited
Market volatility in context
Days like today are a reminder of why being an investor can be so hard.
Over the last three weeks, from their most recent respective highs, the S&P 500 has fallen by -8.5%, the Nasdaq-100 has fallen by -13.5%, and the Russell 2000 has fallen by -11.3%.
In the grand scheme of things, this is simply a blip on the radar — but after nearly two years of “up and to the right” price action, it sure feels like the sky is falling and falling fast.
During periods of market stress, I always find it helpful to level set expectations and remind investors that periods like the current stretch are perfectly normal for long-term investors. When you invest through multiple cycles, we should no longer find periods like this surprising. Quite the opposite, in fact – we should always be expecting the next bout of volatility or a stock market pullback around the corner.
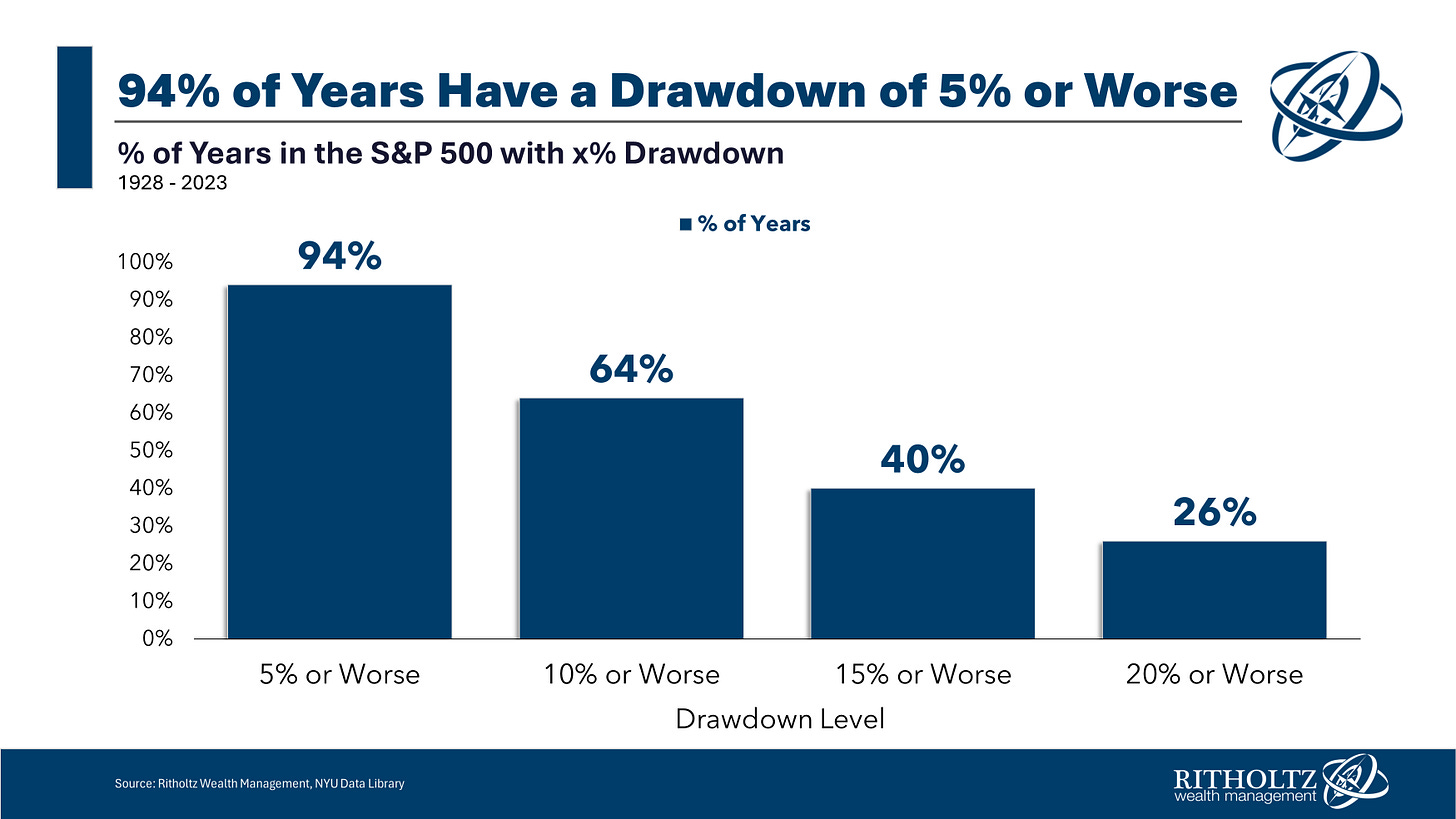
Below is a chart from the venerable Ben Carlson that he shared just yesterday.
It shows 5% pullbacks have happened nearly every year over the last century. 10% corrections – like the current state of markets – occur roughly two-thirds during each calendar year. Even a 15% drawdown occurs quite regularly at 40% of historical calendar periods. It’s only the 20% or greater drawdowns that occur rather infrequently.
Meaning, the current bout of market weakness is perfectly normal for anyone who has been investing in financial markets for more than a year or two. Volatility is a natural part of the investing process, reflecting market uncertainty and opportunities.
The other chart I often reference during periods of market declines comes from J.P. Morgan.
It shows that since 1980, the S&P 500 has averaged an intra-year decline of 14.2%, yet at the same time the index has also managed to produce a positive calendar return 75% of the time.
The takeaway: markets can (and do) move higher each year despite incurring some soul-crushing defeats along the way. The historical record shows the probabilities favor the outcome that we should be ok in the end.
Volatility is a feature of investing, not a bug. It only becomes a problem for investors if it disrupts their investment process and strategy and causes them to react emotionally.
For most people, these market pullbacks should be viewed as opportunities, allowing patient investors to buy quality assets at discounted prices.
Source: Ben Carlson, J.P. Morgan Guide to the Markets
Wall Street ramps up forecasts on timing, size of interest rate cuts
The pressure on the Federal Reserve to cut rates is rising in the wake of heavy selling pressure in the stock market (although this falls outside the scope of the Fed’s stated mandate, to be clear) and a disappointing jobs report that's stoking renewed recession fears of a hard landing.
A slew of weaker-than-expected economic data over recent months, highlighted most recently by last week’s July jobs report triggering a closely watched recession indicator dubbed the Sahm Rule, has many arguing the Fed's current policy rate is far too restrictive given the success on the inflation front and some softening in the labor market.
The bond market is responding quickly, now betting the Fed will be forced to act more aggressively than expectations just a few short weeks ago.
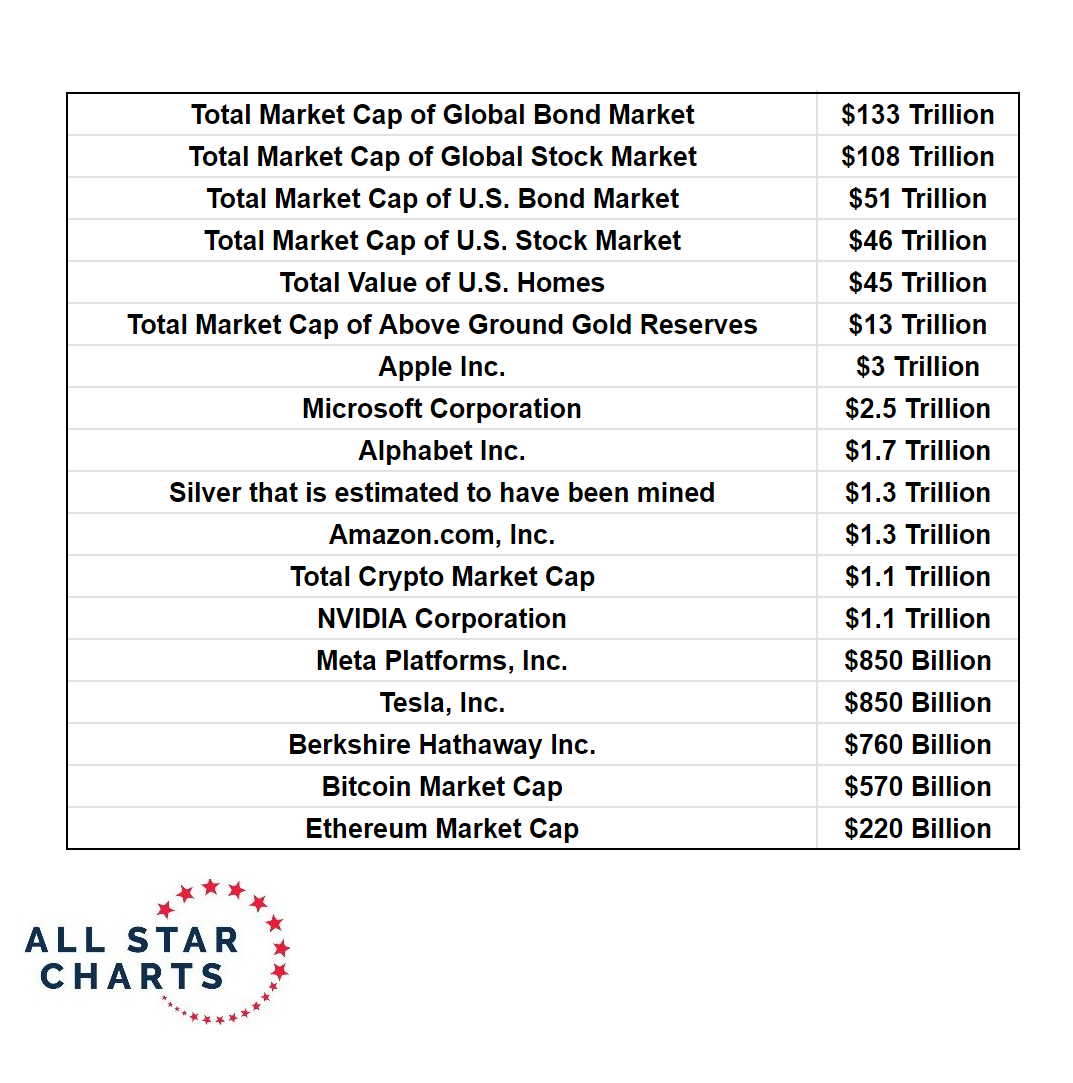
Remember, the bond market is the largest of all markets and arguably moves all other asset classes. See its relative size (and thus its importance) below. It’s impact and influence cannot be dismissed.
For several months, the 1st cut of 25 basis points – just a fraction of the amount the Fed raised rates during 2022-2023 – was fully priced into the upcoming September 18 meeting.
In just the last few days, the pendulum has firmly swung in favor of 50 basis points, or a double hike if you will.
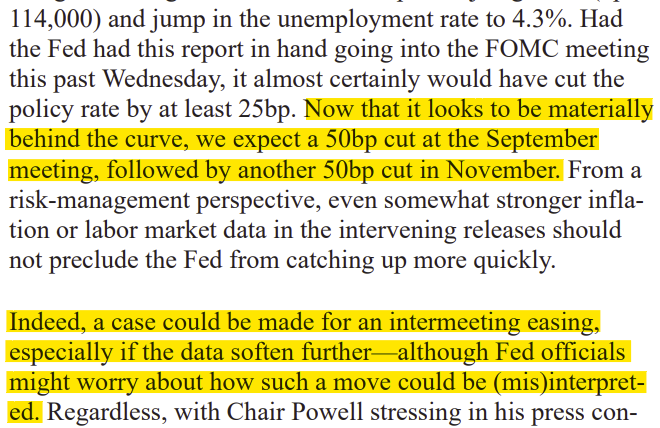
In a note to clients on Friday of last week, J.P. Morgan Chief Economist Michael Feroli argued that the Federal Reserve is at least 100 bps offsides, or more.
"So we now think the FOMC cuts by 50bp at both the September and November meetings, followed by 25bp cuts at every meeting thereafter."
Michael even suggests there is a growing argument for a rate cut prior the next scheduled FOMC meeting.
The shift in expectations, from market positioning to the Wall Street strategists, will put a microscope on the upcoming comments from Federal Reserve officials whom are scheduled to speak this week, including Austan Goolsbee, Mary Daly, and Tom Barkin.
Source: The Kobeissi Letter, All Star Charts, CME Group, J.P Morgan Markets
It’s a bird… it’s a plane… it’s the volatility index ??!?
The CBOE Volatility Index (VIX) gave us its biggest pop today since it exploded during the early days of the covid-19 pandemic. Today was the 4th most volatile market day in the last four decades.
The VIX briefly spiked to 65 today, a level only seen a few other times in its history – Black Monday in October 1987, the Global Financial Crisis in 2008, and the covid-19 pandemic in 2020.
Now, we can add the unwinding of the Japanese Yen carry trade to that short list. For a detailed explanation of the Japanese Yen carry trade, here is Barron’s and CNBC to explain.
This means the VIX briefly exploded higher by more than +500% from its July 2024 lows.
Our crypto friends would label today’s market action a god candle.
Source: Ark Invest
Warren Buffett cuts Berkshire stake in Apple by half
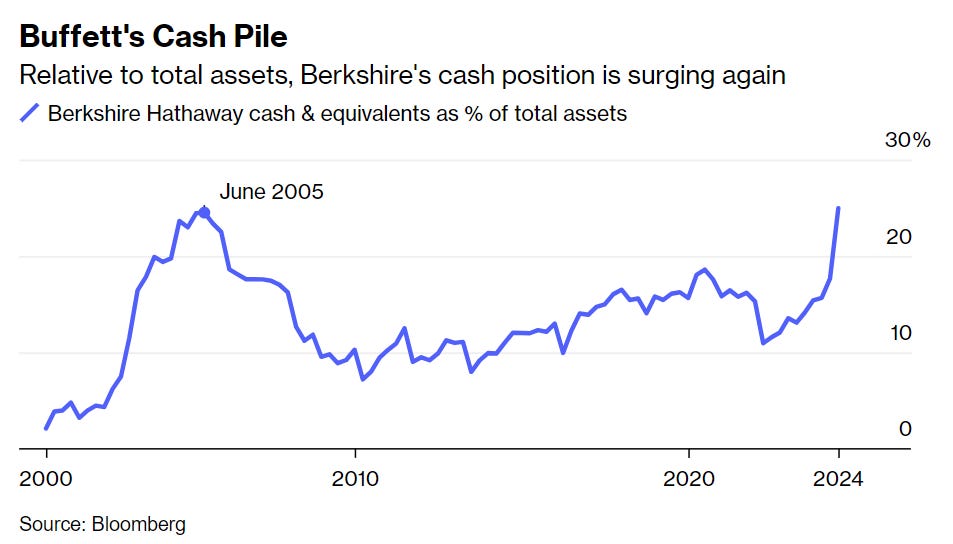
Warren Buffett raised the cash position of Berkshire Hathaway to a record $277 billion as he sold nearly half its stake in Apple over the course of the 2nd quarter. Prior to the recent divestitures, Apple represented nearly half the public equity holdings of Berkshire Hathaway.
The conglomerate has been a net seller of stocks for seven straight quarters, but that accelerated during the second quarter with it selling more than $75 billion in equities in Q2.
The buildup of cash has some investors a bit spooked.
While most likely a risk management decision – Apple’s slowing sales of late and its elevated valuation on one side, position sizing within Berkshire’s portfolio on the other side – some are worried the excessive cash pile that has been slowly building reflects a lack of asymmetric opportunities present in the market to entice Berkshire Hathaway to deploy its cash into new opportunities.
Cash and equivalents now account for ~25% of Berkshire’s total assets, which is substantially higher than the 13% average since 1997 and approaching its most recent high in June 2005.
The announcement of uncle Warren divesting half of Berkshire’s Apple position over the weekend likely contributed in some small part to the poor sentiment and heavy selling pressure in today’s session.
Source: Financial Times, Bloomberg
That’s all for today.
Blake
Welcome to The Sandbox Daily, a daily curation of relevant research at the intersection of markets, economics, and lifestyle. We are committed to delivering high-quality and timely content to help investors make sense of capital markets.
Blake Millard is the Director of Investments at Sandbox Financial Partners, a Registered Investment Advisor. All opinions expressed here are solely his opinion and do not express or reflect the opinion of Sandbox Financial Partners. This Substack channel is for informational purposes only and should not be construed as investment advice. The information and opinions provided within should not be taken as specific advice on the merits of any investment decision by the reader. Investors should conduct their own due diligence regarding the prospects of any security discussed herein based on such investors’ own review of publicly available information. Clients of Sandbox Financial Partners may maintain positions in the markets, indexes, corporations, and/or securities discussed within The Sandbox Daily. Any projections, market outlooks, or estimates stated here are forward looking statements and are inherently unreliable; they are based upon certain assumptions and should not be construed to be indicative of the actual events that will occur.


