Troubling elementary student test scores, plus a 3rd quarter earnings season update, the recent weakness in the U.S. dollar, and Bitcoin's volatility contracts
The Sandbox Daily (10.26.2022)
Welcome, Sandbox friends.
Today’s Daily discusses the troubling national elementary test scores on both mathematics and reading, a 3rd quarter earnings mid-season update, the recent sagging U.S. dollar, and Bitcoin’s volatility contraction.
Let’s dig in.
Markets in review
EQUITIES: Russell 2000 +0.46% | Dow +0.01% | S&P 500 -0.74% | Nasdaq 100 -2.26%
FIXED INCOME: Barclays Agg Bond +0.42% | High Yield +0.27% | 2yr UST 4.418% | 10yr UST 4.007%
COMMODITIES: Brent Crude +2.69% to $96.04/barrel. Gold +0.67% to $1,668.5/oz.
BITCOIN: +3.34% to $20,779
US DOLLAR INDEX: -1.01% to 109.736
CBOE EQUITY PUT/CALL RATIO: 0.62
VIX: -4.15% to 27.28
Troubling results from the NAEP 2022 mathematics and reading assessments
Student test scores declined across the country, particularly in math, and not one state saw an increase, according to a report from the National Assessment of Educational Progress showing the most comprehensive look at the impact of the pandemic on student achievement to date. Declines were seen among high- and low-performing students alike, for both 4th and 8th graders in math and reading. Overall, scores fell to levels not seen in two decades.
The portion of 8th-graders rated proficient or better in math fell to 27%, from 34% in 2019. Average math scores for 8th grade fell by 8 points, from 282 in 2019 to 274 this year, on a 500-point scale.
The average math score in 4th grade fell by 5 points, from 241 in 2019 to 236 this year.
These are the steepest declines recorded in more than a half century of testing. The results provide the clearest picture yet of the pandemic’s effects on our kids education and how steep a climb American educators face as they embark on what is likely to be a yearslong effort to help students make up ground that was missed as schools struggled to operate effectively during the pandemic.
Source: Wall Street Journal
3rd quarter earnings mid-season update
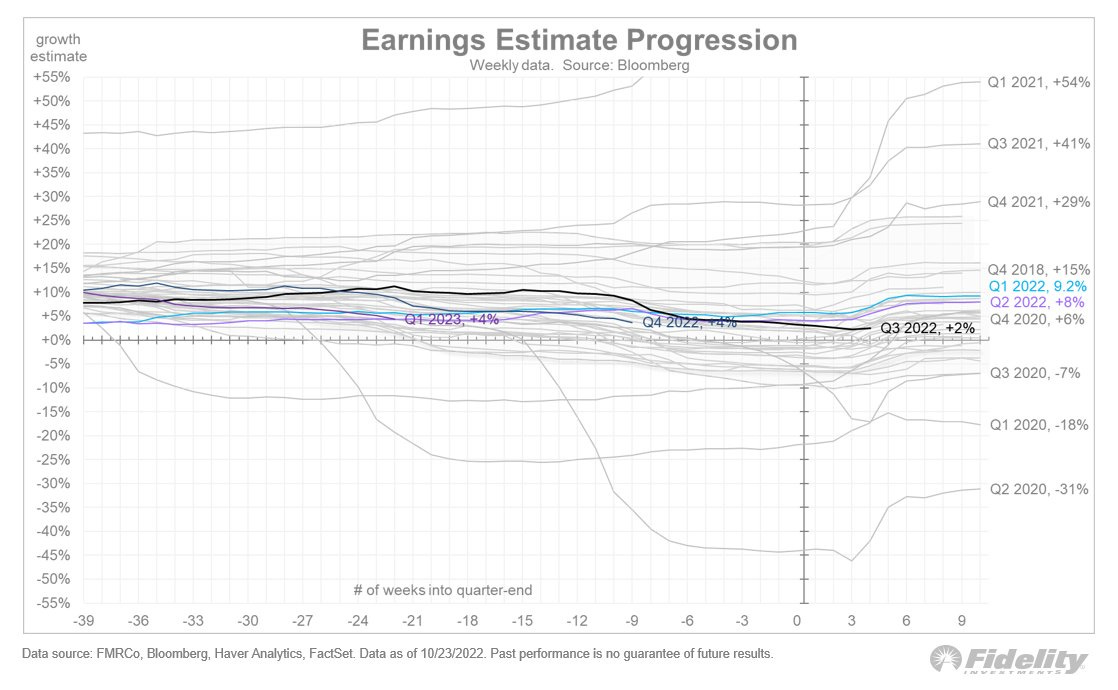
Earnings season is now in full swing, and so far, it looks like any other earnings season. With 129 companies reporting, 71% are beating estimates by an average of 4.7%. This is pretty much a repeat of the second quarter “nothing to see here” earnings season.
3rd quarter earnings are hitting their targets, but of course, earnings growth is slowing—in fact, 71% of industry groups are seeing downward revisions. All things considered, the hoped-for soft landing looks real. That might prove to be a mirage next year, but not yet.
With earnings in a “slowing but not contracting” mode, here's a look at past peaks in earnings growth. As you can see, not all peaks lead to contractions. In this cycle, earnings growth peaked in 2021 and is expected to flatten out by the end of this year, then resume in 2023.
What typically happens to the S&P 500 after earnings growth peaks (as it most recently did in 2021)? As the chart below shows, there is no "typical." However, current price action is tracking the 1947 and 1973 cycles, both of which were inflationary periods.
Source: Jurien Timmer
Dollar weakness now evident
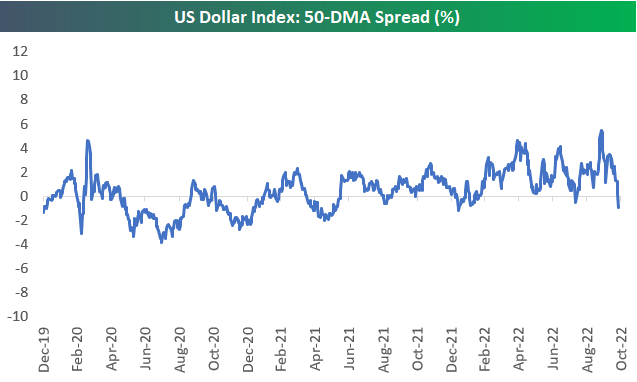
The U.S. Dollar Index is now down -4.39% from its intraday high on September 28th. Today it broke below its 50-Daily Moving Average (DMA) and is the farthest below its 50-DMA since January 13, 2022 at -0.94%.
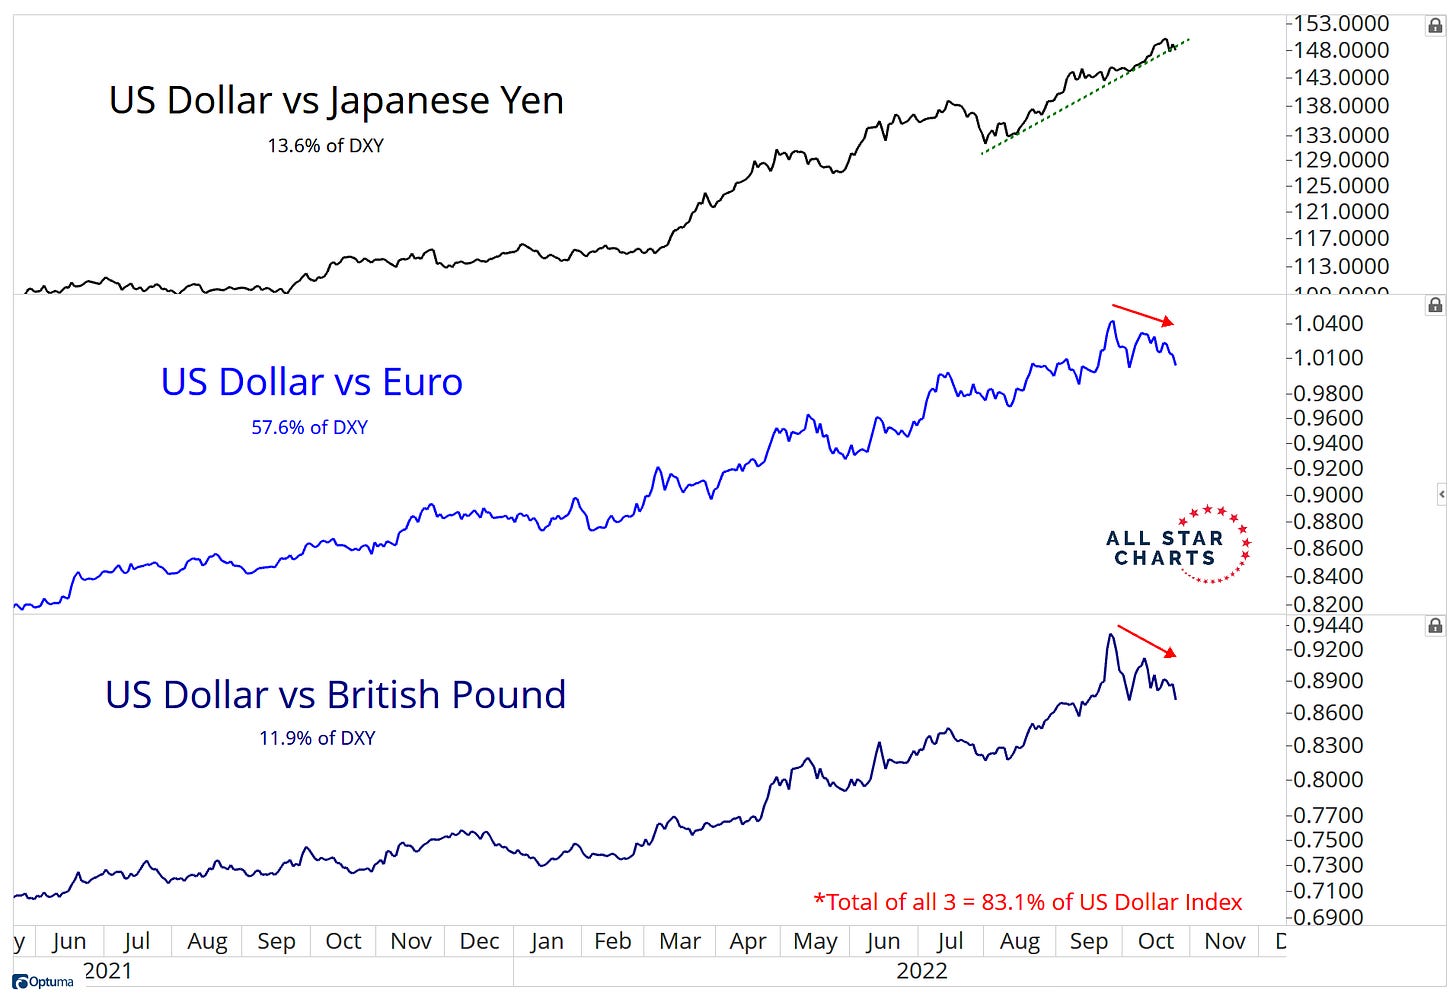
The Dollar is rolling over versus both the Euro and British Pound. Since 70% of the US Dollar Index peaked in late September, stock market buyers have been very aggressive in October. Just a little bit of Dollar weakness has sparked a serious rally in stocks, but for this buying momentum to continue and expand into other, weaker performing segments of the market, this important catalyst must hold.
Source: Bespoke Investment Group, All Star Charts
Bitcoin continues to coil
While macro markets have housed some notable volatility in recent months, Bitcoin appears to be stuck in a trendless market. Bitcoin's price volatility, as measured by the width of its monthly Bollinger bands, is at its lowest level since June 2020.
Regardless of which market we're analyzing, when price action becomes more coiled, buyers or sellers are ultimately forced to react. This period of shrinking volatility is often met with violent unwinding in either direction.
With Bitcoin booking its largest single-day gain in over a month yesterday, a new period of volatility expansion could be beginning. It’s fair to say that short-term momentum is once again flowing back into this market. We can never know whether it’s just yet another bear market rally or the beginning stages of something more substantial. Be on the lookout for upside follow-through this week for confirmation that a fresh leg higher could be underway.
Big picture, Bitcoin and Ether continue to weather one of the toughest market environments in quite some time, showing resiliency and staying power despite price weakness. In fact, since June 30th, Bitcoin and Ether – which did not undercut the summer lows like most other asset classes – have gained +4.1% and +31.6% while the S&P 500 lost -0.4% and the 10-yr Treasury rose from 3.0% to 4.2%.
Source: All Star Charts, Eaglebrook Advisors
That’s all for today.
Blake
Welcome to The Sandbox Daily, a daily curation of relevant research at the intersection of markets, economics, and lifestyle. We are committed to delivering high-quality and timely content to help investors make sense of capital markets.
Blake Millard is the Director of Investments at Sandbox Financial Partners, a Registered Investment Advisor. All opinions expressed here are solely his opinion and do not express or reflect the opinion of Sandbox Financial Partners. This Substack channel is for informational purposes only and should not be construed as investment advice. Clients of Sandbox Financial Partners may maintain positions in the markets, indexes, corporations, and/or securities discussed within The Sandbox Daily.


