TSA travel data, plus stock ownership at record highs, growth/value, narrow breadth, and initial jobless claims
The Sandbox Daily (6.6.2024)
Welcome, Sandbox friends.
The European Central Bank joined the Bank of Canada in initiating an interest rate-cutting cycle this week (a sign of a shifting global economic landscape), Nvidia CEO Jensen Huang is signing autographs on woman’s breasts, and Boeing's Starliner makes orbit at long last.
Today’s Daily discusses:
TSA travel data confirms the consumer is not faltering
more Americans own stocks than ever before
growth/value ratio facing critical overhead resistance
narrow breadth in 2024 follows a similar path from 2023
initial jobless claims remain subdued
Let’s dig in.
Markets in review
EQUITIES: Dow +0.20% | S&P 500 -0.02% | Nasdaq 100 -0.07% | Russell 2000 -0.70%
FIXED INCOME: Barclays Agg Bond +0.03% | High Yield -0.17% | 2yr UST 4.728% | 10yr UST 4.289%
COMMODITIES: Brent Crude +1.91% to $79.90/barrel. Gold +0.72% to $2,392.5/oz.
BITCOIN: -0.81% to $70,685
US DOLLAR INDEX: -0.14% to 104.121
CBOE EQUITY PUT/CALL RATIO: 0.75
VIX: -0.40% to 12.58
Quote of the day
“Never say you can't do it. Say I haven't done it yet.”
- Rick Rubin, Music Producer
TSA travel data confirms the consumer is not faltering
The Transportation Security Administration (TSA) has had a busy few years this side of the pandemic, as the agency has faced more and more travelers passing through its checkpoints each year consecutively since 2020.
For markets, this is important because consumer services continue to be the key reason why the economy, despite significant Fed hikes, is still holding up.
As Torsten Slok, Chief Economist at Apollo, notes: “The TSA has daily data for the number of people scanning their boarding pass with a TSA agent, and it continues to show no signs of the economy slowing down.”
Source: Torsten Slok
More Americans own stocks than ever before
The share of Americans who own stocks has never been higher. About 58% of U.S. households owned stocks in 2022, according to a Federal Reserve survey of consumer finances.
Also encouraging is the percentage of households owning stocks increased across all income levels from 2019 to 2022. In fact, middle-income families recorded the biggest jump in stock ownership.
The pandemic and zero-commission trading created a whole new pool of investors.
Source: Piper Sandler
Growth/value ratio facing critical overhead resistance
The S&P 500 Index’s 4.8% jump in May was led by large-cap Growth stocks. The rally pushed the Russell 1000 Growth/Value ratio to multi-year resistance – see top pane in the chart below.
This is the Russell 1000 Growth/Value ratio’s 3rd attempt to break above its September 2020 high.
A breakout would leave the Russell 1000 Growth/Value ratio within 12% of its March 2000 all-time high.
Source: Ned Davis Research
Narrow breadth in 2024 follows a similar path from 2023
Whether famous or infamous, the Magnificent 7 stocks have been the stock market story for the better part of two years. They have dominated indices to the point that some Large Cap Growth Funds no longer qualify as diversified portfolios under the 1940-Act, and they have dominated market performance so much that markets have the narrowest leadership since the Technology Bubble.
As you might hear on CNBC, analysts will say narrow leadership is typically the result of deteriorating fundamentals in the broader market. When the profits cycle decelerates, investors gravitate to the fewer and fewer companies that can maintain growth during an increasingly adverse backdrop. Leadership narrows as fundamentals deteriorate, and growth becomes scarce.
But that is not the case today – earnings are hooking higher, while the economy continues to expand at or around trend growth. More importantly, in regards to the breadth chart above, another explanation for a lower percentage of stocks outperforming the index is how much mega-cap stocks are distorting index performance due to their sheer size and contribution weights.
Source: Richard Bernstein
Initial jobless claims remain subdued
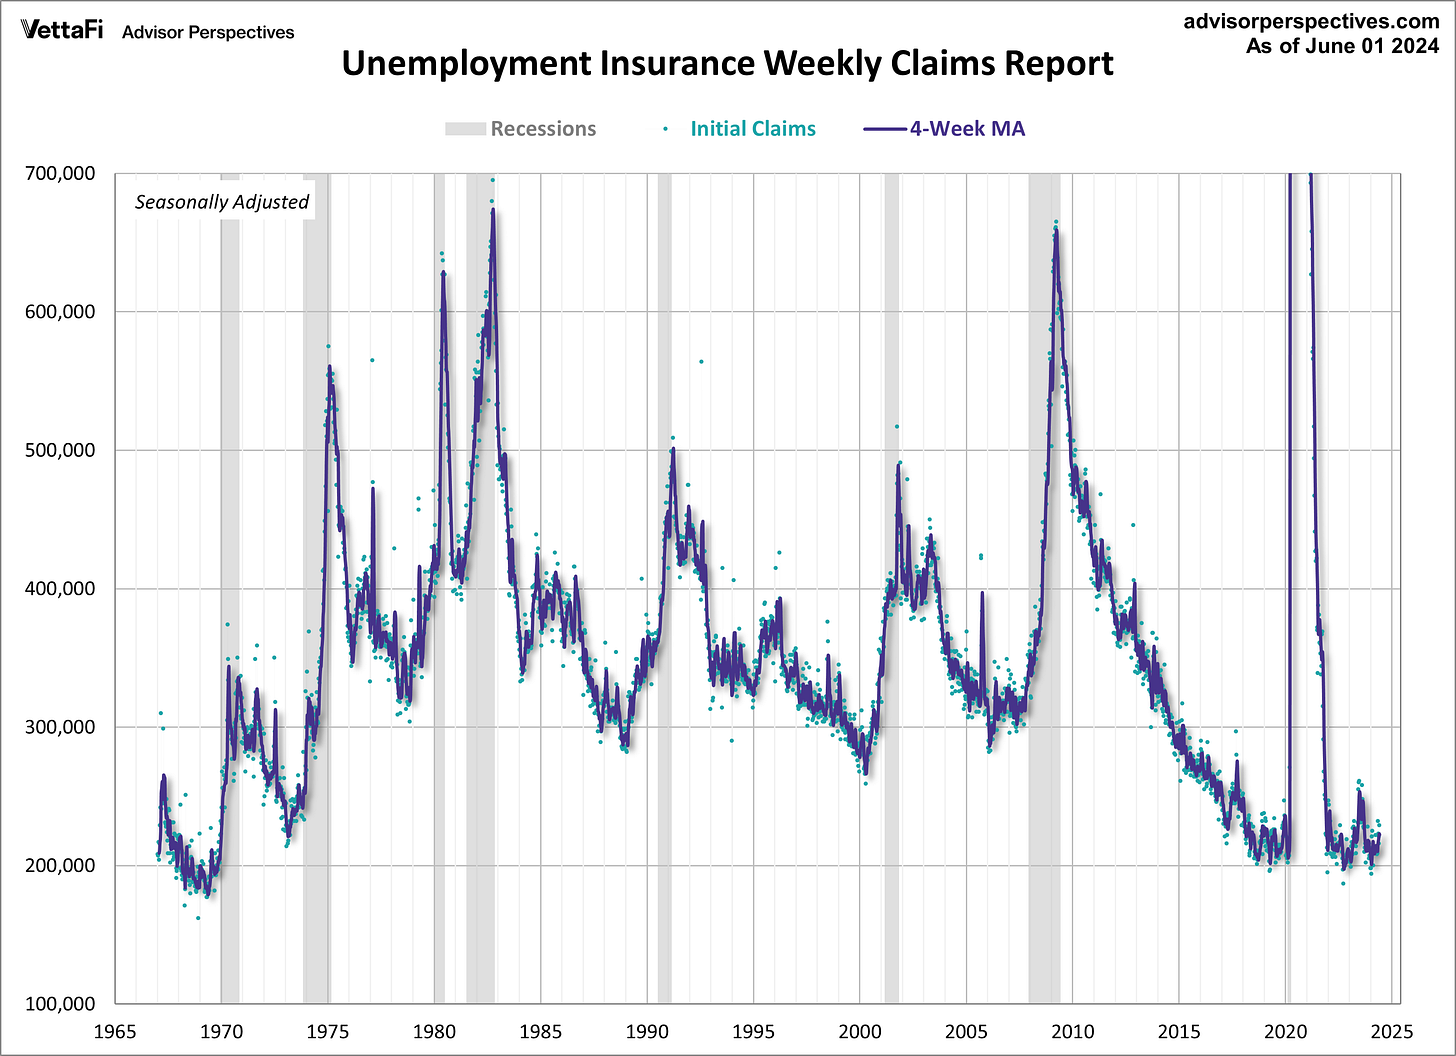
The number of people filing initial applications for U.S. unemployment insurance rose by 8,000 last week to 229,000, above the consensus estimate of 220,000. The 4-week moving average, to smooth out weekly volatility and unnecessary noise, remained flat at 222,250.
Even so, initial claims remain range-bound since late-2021. The current level is close to pre-pandemic and low by historical norms, reflecting robust labor demand and a continued economic expansion.
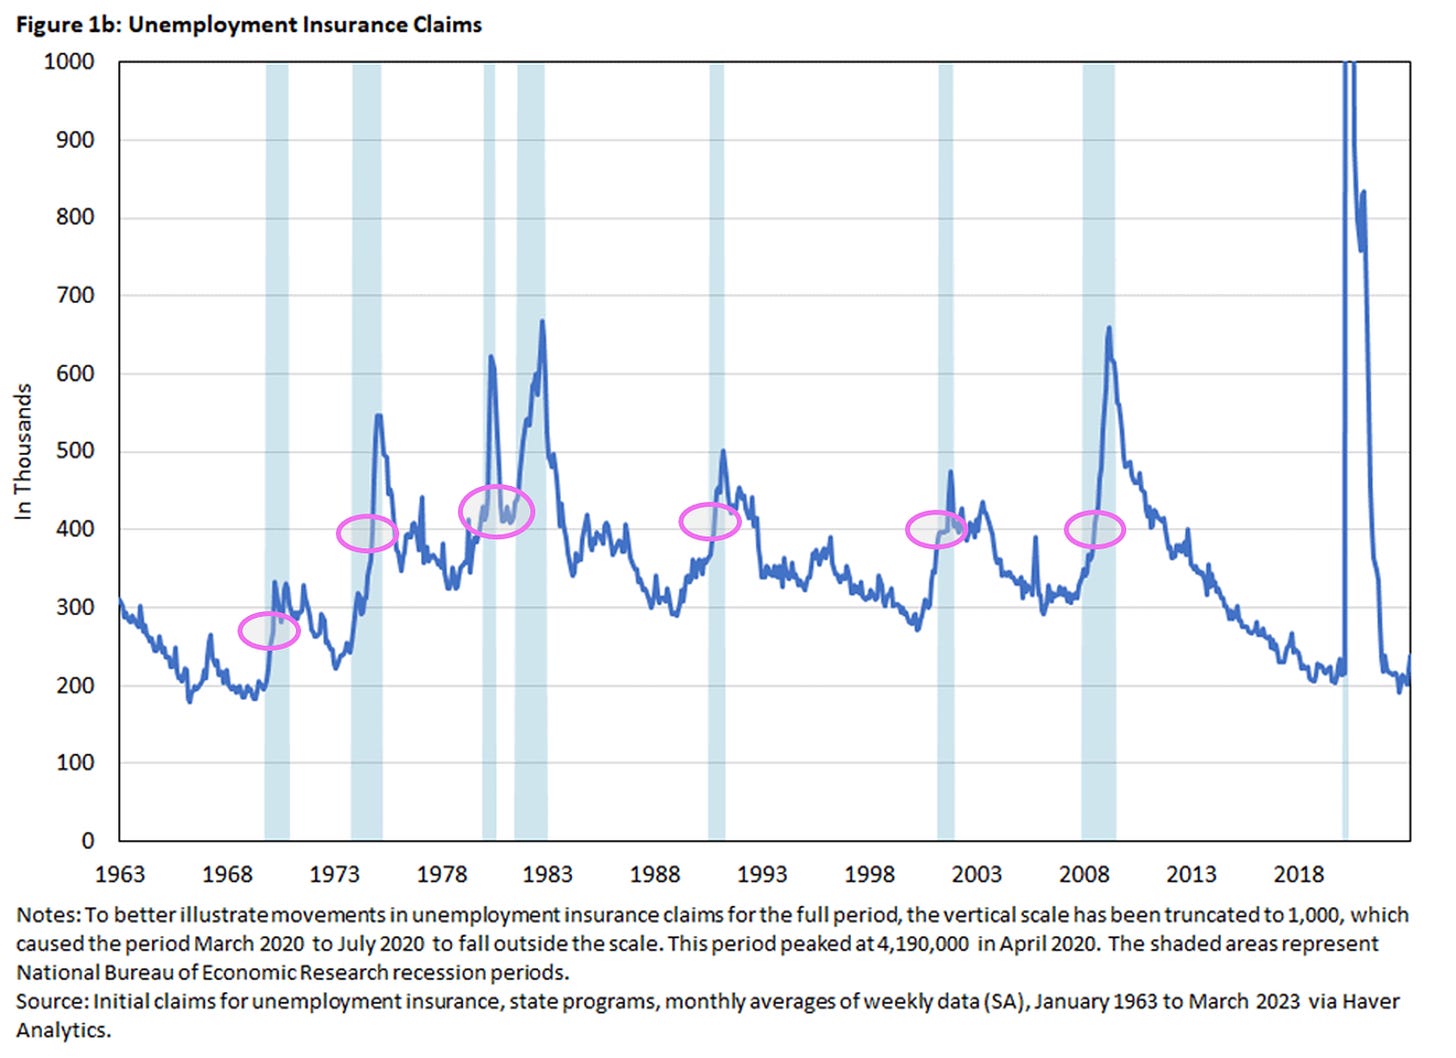
Many view changes in initial unemployment insurance (UI) claims as coincident indicators for the start of recessions.
Generally speaking, when initial claims edges above 350,000-400,000, the signal has historically coincided with the onset of recession. At 229,000, we remain far below key levels of interest.
Continuing claims, tracking those who collect unemployment benefits beyond the 1st week, inched higher by 2,000 to 1.792 million – also range-bounds near pre-pandemic levels.
"The level (of weekly jobless claims) remains in a range that suggests the labor market remains tight," said Thomas Simons, U.S. economist at Jefferies. "Continuing claims are still very low by any historical standard.”
The labor market has been slowly and steadily rebalancing back toward pre-pandemic levels after the Fed raised interest rates by roughly 525 basis points since March 2022 to slow demand in the overall economy.
Chris Zaccarelli, chief investment officer at Independent Advisor Alliance, said there has been a shift in markets from obsessing over inflation data to worrying about economic growth.
“Ironically, a slowing in the job market, and even an increase in unemployment, should be welcome to the extent that it alleviates some upwards pressure on inflation–which we agree is what is the most important thing to focus on–but we are aware that too much weakness in the labor market and in the economy could eventually prove to be an even greater threat to markets than inflation that is 1-2% above the Fed’s target,” Zaccarelli wrote.
Source: Advisor Perspectives, Richmond Fed
That’s all for today.
Blake
Welcome to The Sandbox Daily, a daily curation of relevant research at the intersection of markets, economics, and lifestyle. We are committed to delivering high-quality and timely content to help investors make sense of capital markets.
Blake Millard is the Director of Investments at Sandbox Financial Partners, a Registered Investment Advisor. All opinions expressed here are solely his opinion and do not express or reflect the opinion of Sandbox Financial Partners. This Substack channel is for informational purposes only and should not be construed as investment advice. The information and opinions provided within should not be taken as specific advice on the merits of any investment decision by the reader. Investors should conduct their own due diligence regarding the prospects of any security discussed herein based on such investors’ own review of publicly available information. Clients of Sandbox Financial Partners may maintain positions in the markets, indexes, corporations, and/or securities discussed within The Sandbox Daily. Any projections, market outlooks, or estimates stated here are forward looking statements and are inherently unreliable; they are based upon certain assumptions and should not be construed to be indicative of the actual events that will occur.


