

Two key directional indicators flashed green. What it means for stocks in 2026.
The Sandbox Daily (2.3.2026)

Welcome, Sandbox friends.
Today’s Daily discusses:
two key directional indicators flash green
Let’s dig in.
Blake
Markets in review
EQUITIES: Russell 2000 +0.31% | Dow -0.34% | S&P 500 -0.84% | Nasdaq 100 -1.55%
FIXED INCOME: Barclays Agg Bond +0.01% | High Yield -0.06% | 2yr UST 3.571% | 10yr UST 4.267%
COMMODITIES: Brent Crude +3.49% to $68.19/barrel. Gold +6.96% to $4,976.2/oz.
BITCOIN: -2.08% to $76,329
US DOLLAR INDEX: -0.29% to 97.346
CBOE TOTAL PUT/CALL RATIO: 0.93
VIX: +10.16% to 18.00
Quote of the day
“In this business, predictions are over-rated, but the mismatch between expectations and probable outcomes are underrated.”
- Jeff deGraaf, Renaissance Macro Research
Key “First Five Days” and “January Barometer” favor the bulls
Technical Analysis is the study of market behavior and therefore its market participants.
It’s an examination of how humans behave through the simple actions of buying and selling. Price is the official arbiter of truth.
While not a technician myself, we CFAs love our CMT counterparts. Their community provides excellent analysis and view markets through an entirely different lens.
Using complementary tools in your process improves your edge and provides a higher probability of investing success. That’s why always we keep an open mind.
The “First Five Days” rule and the “January Barometer” signal are two technical markers that argue early calendar-year strength often sets the tone for the rest of the year because it quantifies the demand for stocks.
As the old adage states: “as goes January, so goes the year.”
Let’s review these two key directional indicators that both flashed green in January .
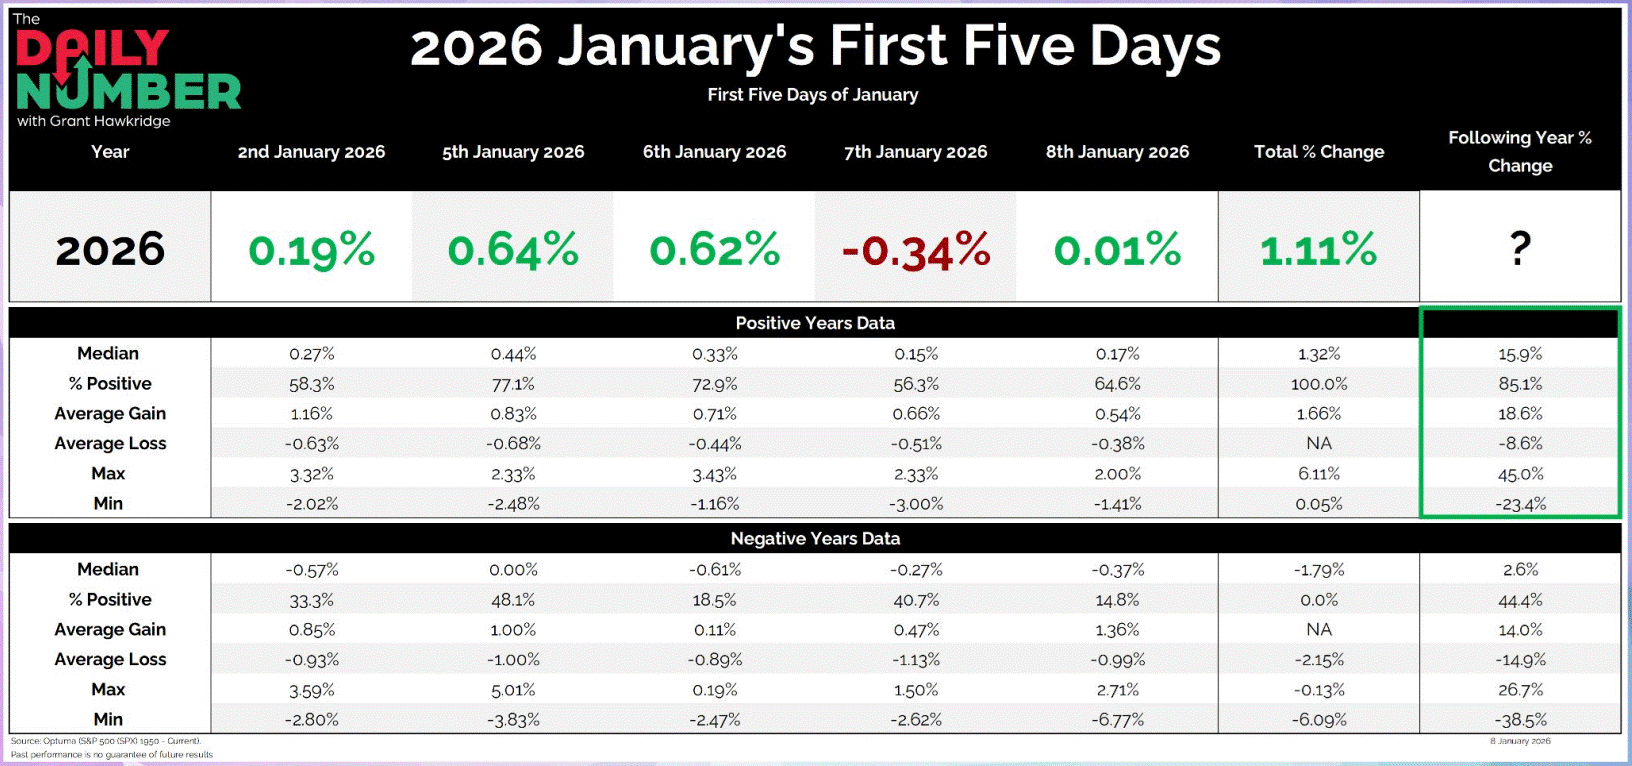
First Five Days
The First Five Days of 2026 saw the S&P 500 index rise by +1.11% during this period.
This typically bodes well for the rest of the year because closing green vastly improves the probability that the full calendar year will end positive as well.
When the First Five Days of January are positive, the S&P 500 index is higher by a median gain of +15.9% with an 85% positivity rate since 1950.
Compare that to a negative First Five Days when the S&P 500 gains just +2.6% and is positive only 44% of the time.
Historically, the stock market has tended to perform better – and much more consistently – when the First Five Days of the year show a gain of any size.
January Barometer
Meanwhile, the January Barometer is the belief held by technicians that investment performance of the S&P 500 index in January can predict its performance for the rest of the year.
If buyers win the battle against sellers over the entire month of January, the historical data shows that stocks tend to hold onto those gains. What’s more, the hit rate is very compelling.
When January is positive, the median return for the rest of the year is +13.4%, with an 87% win ratio.
When January is negative, the median return falls to +3.5%, with a 60% win ratio.
The January Barometer saw the S&P 500 index rise by +1.36% during this period.

Of course, these signals firing green are not enough alone to carry the market higher. They’re just one piece to the giant puzzle.
Similar to other seasonal patterns, these signals provide us information about the type of market environment we’re in. Are stocks behaving as we expect or not?
As goes January, so goes the year
With stocks inching higher during both the First Five Days as well as the month of January, the market cleared two early hurdles that are generally positive omens for future calendar year performance.
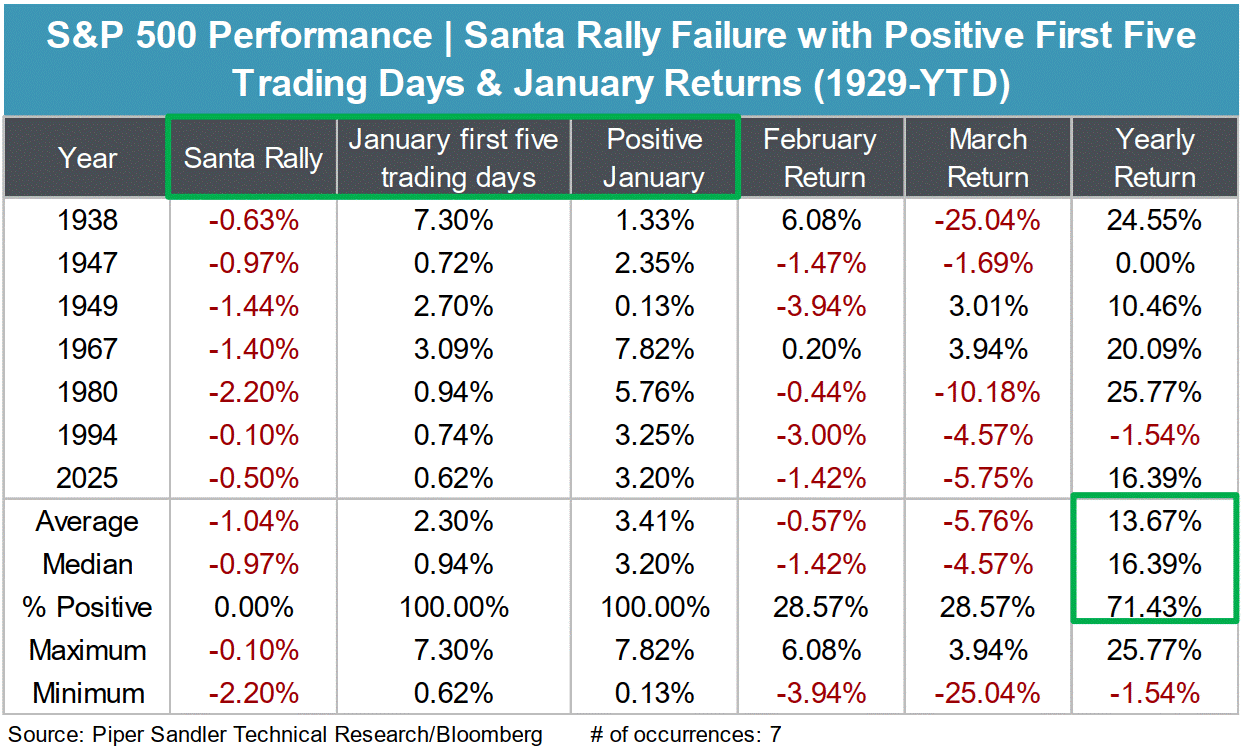
If we also consider the Santa Claus Rally being negative this year, we can use the triple indicator as found in the Stock Trader’s Almanac for additional context.
This table below shows that short-term returns are a bit hairy for February and March, however the median calendar year return is a healthy +16.39% return with a 71% positivity rate.
Good news but of course a very small sample size.
Bottom line? These technical markers suggest further gains could lie ahead for investors in 2026.
At risk of stating the obvious, we should remember that these are weight-of-the-evidence indicators and not a trading strategy.
Instead, we study history to help level set expectations as investors and establish a range of possible outcomes so that we make more informed decisions to increase our odds of success.
Happy hunting !
Sources: Grant Hawkridge, The Market Stats, Piper Sandler
That’s all for today.
Blake
Questions about your financial goals or future?
Connect with a Sandbox financial advisor – our team is here to support you every step of the way!
Welcome to The Sandbox Daily, a daily curation of relevant research at the intersection of markets, economics, and lifestyle. We are committed to delivering high-quality and timely content to help investors make sense of capital markets.
Blake Millard is the Director of Investments at Sandbox Financial Partners, a Registered Investment Advisor. All opinions expressed here are solely his opinion and do not express or reflect the opinion of Sandbox Financial Partners. This Substack channel is for informational purposes only and should not be construed as investment advice. The information and opinions provided within should not be taken as specific advice on the merits of any investment decision by the reader. Investors should conduct their own due diligence regarding the prospects of any security discussed herein based on such investors’ own review of publicly available information. Clients of Sandbox Financial Partners may maintain positions in the markets, indexes, corporations, and/or securities discussed within The Sandbox Daily. Any projections, market outlooks, or estimates stated here are forward looking statements and are inherently unreliable; they are based upon certain assumptions and should not be construed to be indicative of the actual events that will occur.
Please see additional disclosures (click here)
Please see our SEC Registered firm brochure (click here)
Please see our SEC Registered Form CRS (click here)