U.S. dollar strength, plus Instacart, drivers over different time horizons, and a guest spot with All Star Charts
The Sandbox Daily (9.18.2023)
Welcome, Sandbox friends.
Today’s Daily discusses:
U.S. dollar higher for 9 straight weeks
IPO market set to deliver Instacart on Tuesday
what drives markets over different time frames
guest spot with All Star Charts
Let’s dig in.
Markets in review
EQUITIES: Nasdaq 100 +0.15% | S&P 500 +0.07% | Dow +0.02% | Russell 2000 -0.69%
FIXED INCOME: Barclays Agg Bond +0.15% | High Yield +0.07% | 2yr UST 5.056% | 10yr UST 4.303%
COMMODITIES: Brent Crude +0.65% to $94.54/barrel. Gold +0.46% to $1,955.2/oz.
BITCOIN: +1.24% to $26,803
US DOLLAR INDEX: -0.23% to 105.081
CBOE EQUITY PUT/CALL RATIO: 0.70
VIX: +1.52% to 14.00
Quote of the day
“’I compile statistics on my traders. My best trader makes money only 63% of the time. Most traders make money only in the 50-55% range. That means you’re going to be wrong a lot. If that’s the case, you better be sure your losses are as small as they can be, and that your winners are bigger.”
- Steve Cohen, Point72 and S.A.C. Capital Advisors
U.S. dollar higher 9 weeks in a row
The U.S. Dollar index has risen for 9 weeks in a row. That's only happened two other times: 2014 and 1997. Back in 2014, the streak of weekly gains was just at the beginning of a monster move in the Dollar.
The U.S. Dollar Index – a geometrically-weighted basket of six currencies consisting of the euro, Japanese yen, British pound, Canadian dollar, Swedish krona, and Swiss franc – has been negatively correlated with equities over the last 5 years. Meaning, as the U.S. Dollar is strengthening, stocks are generally weaker, and vice versa.
As the Dollar has gained strength over the last two months, stocks have been struggling to advance – consolidating much of its gains and stuck in a choppy sideways trading range. This impressive recovery in the Dollar, after hitting year-to-date lows in June, has climbed over 5% due primarily to a stronger-than-expected U.S. economy and higher-for-longer monetary policy from the Fed.
Despite the recent recovery, investors remain largely bearish on the greenback. Speculative net positioning in the Dollar recently fell to a 2+ year low.
Now, the Dollar is trading near an inflection point. A breakout above 106 would imply a bottom has been set in the greenback.
Source: Brown Technical Insights
IPO market set to deliver Instacart on Tuesday
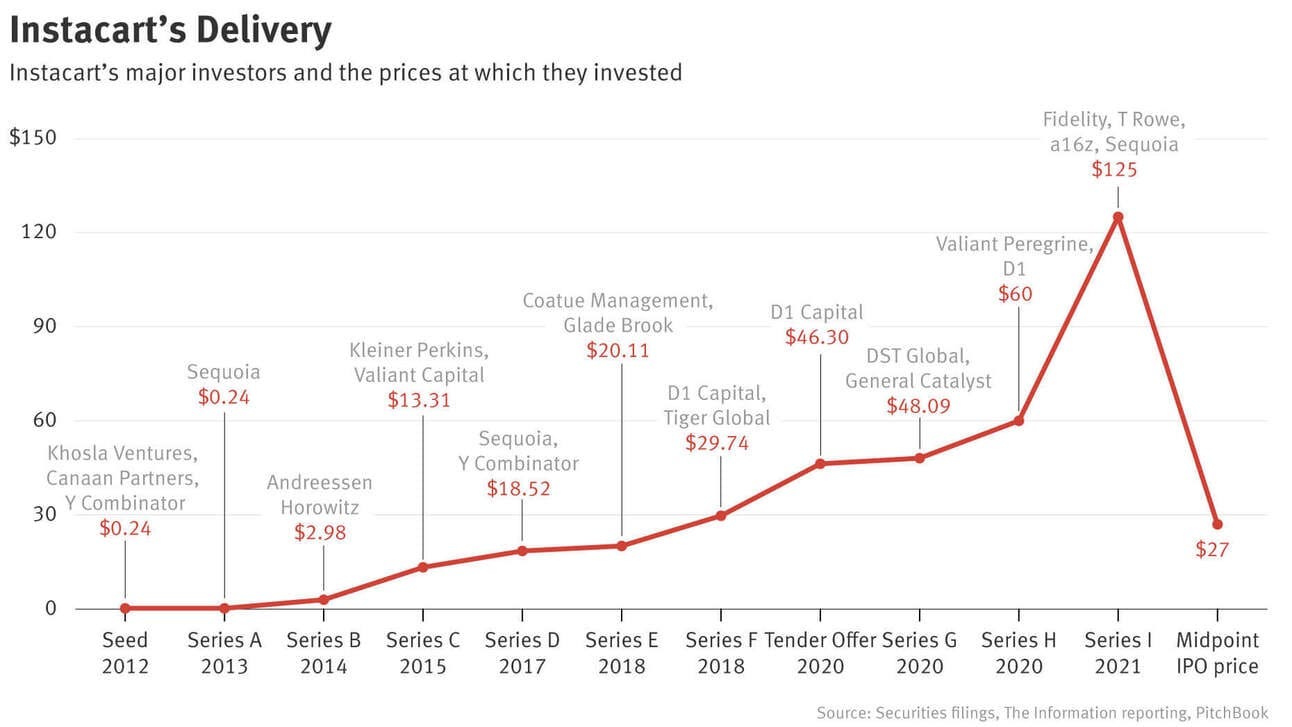
Instacart is set to debut Tuesday for trading on the Nasdaq, raising ~$660 million for a fully diluted valuation of ~$10 billion – a steep plunge from its $39 billion valuation in a 2021 funding round when its business boomed amid pandemic lockdowns.
Sequoia and a16z, two of Silicon Valley’s highest profile venture capital firms, are taking big losses on their Instacart investments, among others. 2018+ investors are underwater vs. the expected IPO price.
Instacart’s IPO comes after a years-long stretch of very few significant venture-backed tech offerings. It follows Klaviyo and Birkenstock’s IPO announcements as well as Arm’s debut last week, showing an early sign that tech offerings could be making a comeback. Depending on how the recent bunch performs, their IPOs could encourage other tech companies to follow.
September will become the top IPO month of 2023, having already raked in more than $5 billion so far.
Maybe the IPO new listings drought is coming to an end, or maybe not. There have been just 17 new listings on the New York Stock Exchange this year following the 24 in 2022. In 2021, there were almost 300 when the market was in a frenzy.
Source: Bloomberg, Reuters, CNBC
What drives markets over different time frames
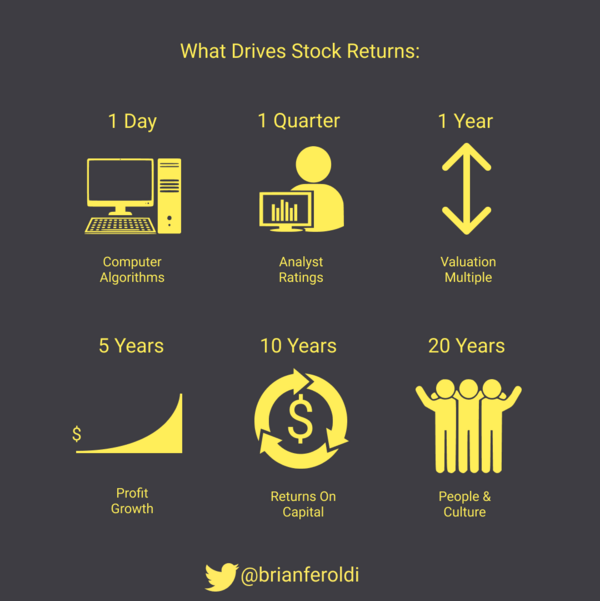
We often get so focused on the day-to-day movements of headlines and portfolio gyrations, it is often difficult to maintain discipline and perspective and not get too emotional. After all, we are human beings with real feelings, not robots. Sometimes we need to take a step back and remember what drives stock returns.
While I don’t agree with every aspect of the graphic above – for example, positioning and sentiment likely weigh more on quarterly time horizons than analyst ratings – this is a helpful reminder that stock prices move over different time horizons for different reasons.
Source: Brian Feroldi
Guest visit with All Star Charts on The Morning Show
Our friends over at All Star Charts – J.C. Parets, Steve Strazza, and Spencer Israel – welcomed me as guest on their daily podcast, The Morning Show, where we discussed equity markets, volatility, yields, structured products, Future Proof, Michigan football, and much more.
Despite some technical difficulties with my microphone, we had some fun chatting through different market themes currently confronting investors. I come in at the 23:30 mark – check it out!
All Star Charts a leading Technical Analysis research platform catering to hedge funds, institutional investors, RIAs, traders, and everyone in between. If you are a market technician or an investor interested in ripping through thousands of charts with thoughtful perspectives layered on top, give them a visit at their website.
That’s all for today.
Blake
Welcome to The Sandbox Daily, a daily curation of relevant research at the intersection of markets, economics, and lifestyle. We are committed to delivering high-quality and timely content to help investors make sense of capital markets.
Blake Millard is the Director of Investments at Sandbox Financial Partners, a Registered Investment Advisor. All opinions expressed here are solely his opinion and do not express or reflect the opinion of Sandbox Financial Partners. This Substack channel is for informational purposes only and should not be construed as investment advice. The information and opinions provided within should not be taken as specific advice on the merits of any investment decision by the reader. Investors should conduct their own due diligence regarding the prospects of any security discussed herein based on such investors’ own review of publicly available information. Clients of Sandbox Financial Partners may maintain positions in the markets, indexes, corporations, and/or securities discussed within The Sandbox Daily. Any projections, market outlooks, or estimates stated here are forward looking statements and are inherently unreliable; they are based upon certain assumptions and should not be construed to be indicative of the actual events that will occur.


