U.S. household debt by the numbers, plus Mag 7, cash balances, and European earnings
The Sandbox Daily (2.6.2024)
Welcome, Sandbox friends.
Today’s Daily discusses:
total U.S. debt rises to $17.5 trillion dollars
“Mag 7” by the numbers
cash rules everything around me (C.R.E.A.M.)
European Q4 earnings tracker
one simple tweet
Let’s dig in.
Markets in review
EQUITIES: Russell 2000 +0.85% | Dow +0.37% | S&P 500 +0.23% | Nasdaq 100 -0.23%
FIXED INCOME: Barclays Agg Bond +0.52% | High Yield +0.36% | 2yr UST 4.397% | 10yr UST 4.087%
COMMODITIES: Brent Crude +0.90% to $78.69/barrel. Gold +0.46% to $2,052.3/oz.
BITCOIN: +1.89% to $43,179
US DOLLAR INDEX: -0.27% to 104.169
CBOE EQUITY PUT/CALL RATIO: 0.65
VIX: -4.46% to 13.06
Quote of the day
“Investors are always searching for good ideas, when what they need are good habits.”
- Jason Zweig
Total U.S. debt rises to $17.5 trillion dollars
Aggregate household debt balances increased by $212 billion (+1.2%) in the 4th quarter of 2023 to reach a total of $17.5 trillion.
The household debt load has increased $3.4 trillion since the onset of the pandemic, despite record government stimulus and a lengthy moratorium on various debt obligations and household expenses.
Mortgage balances were largely unchanged and stood at $12.25 trillion at the end of December – this makes sense given declining mortgage originations and higher interest rates capping transactions. Mortgages make up the overwhelming slice of the total debt pie – see orange bars below.
One reason for the tightening delay in the monetary policy transmission mechanism layered across the United States economy is mortgages, underpinning why the consumer continues to hold up so well in this environment.
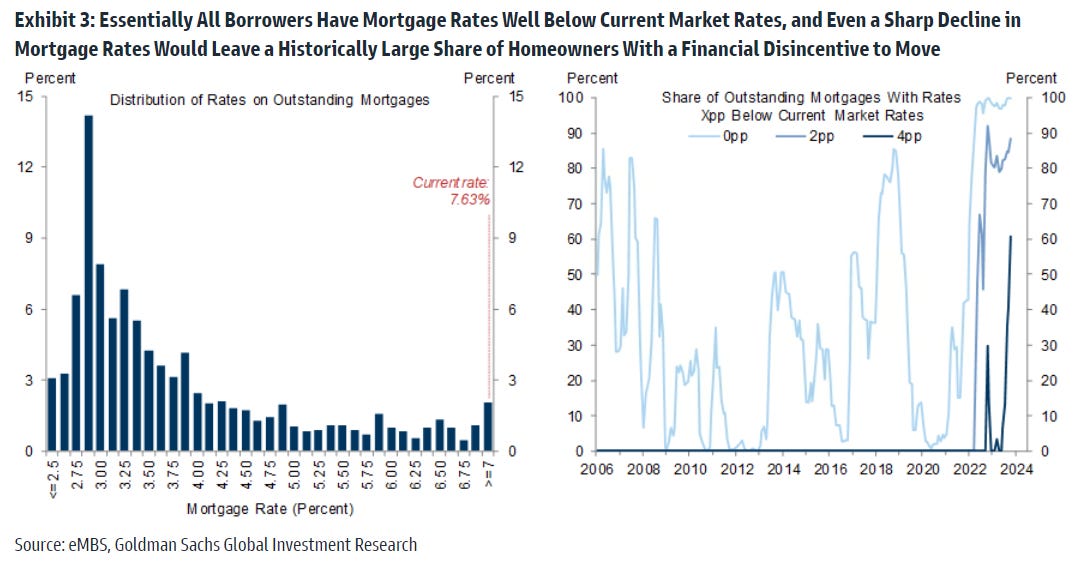
As noted above, mortgages are the biggest consumer debt balance at $12.25 trillion. As noted below, over 80% of Americans are locked into 30-year fixed-rate mortgages under 5% – so increasing interest rates and tightening lending standards hasn’t having the desired effect on the average consumer.
But, the headliner in today’s Quarterly Report on Household Debt and Credit report from the New York Fed?
Credit card debt, of course, which stands at $1.13 trillion – having risen $50 billion, or +4.6%.
Three quick takeaways on credit cards and the popular consumer-is-in-big-trouble narrative:
Credit card balances at $1.13 trillion (navy blue bars below) are just a fraction of the limits available (light blue bars) around $4.79 trillion, so credit in aggregate is not stretched.
As Callie Cox of eToro points out below, the credit card debt load (liabilities) as a percentage of total deposits (assets) is near its lowest levels in 20 years: 6.4% of household deposits, up marginally from 6.1% last quarter.
The percentage of loans in serious delinquency, 90+ days, is virtually flat across all categories save credit cards, which yes have ticked higher and are approaching the pre-pandemic highs but remain miles away from the levels seen during the Global Financial Crisis. While overall delinquency rates may not be flashing red at this point, the levels seen in the 4th quarter are indicative of a slight weakening in household balance sheets.
For now, the consumer is on fine footing, especially with the labor market holding up so strongly in the face of tight monetary policy. Overall delinquency rates have not yet approached concerning levels.
Source: Federal Reserve Bank of New York, Quarterly Report on Household Debt and Credit, Callie Cox, Barron’s
“Mag 7” by the numbers
The “Magnificent 7” – Microsoft, Apple, Google-parent-company Alphabet, Amazon, Nvidia, Meta Platforms (aka Facebook), and Tesla – have been protecting their respective indices and masking the deterioration in market breadth for quite some time now. These hyperscalers are a tour de force that exhibit boast bold forward-thinking leadership at the top, economies of scale, solid fundamentals, reliable earnings, and print free cash flow as if it’s going out of style. The numbers behind these companies is simply incredible.
Are they expensive? Yes, but if your investment strategy was based solely on finding cheap multiples, then you missed out on a decade of tremendous outperformance.
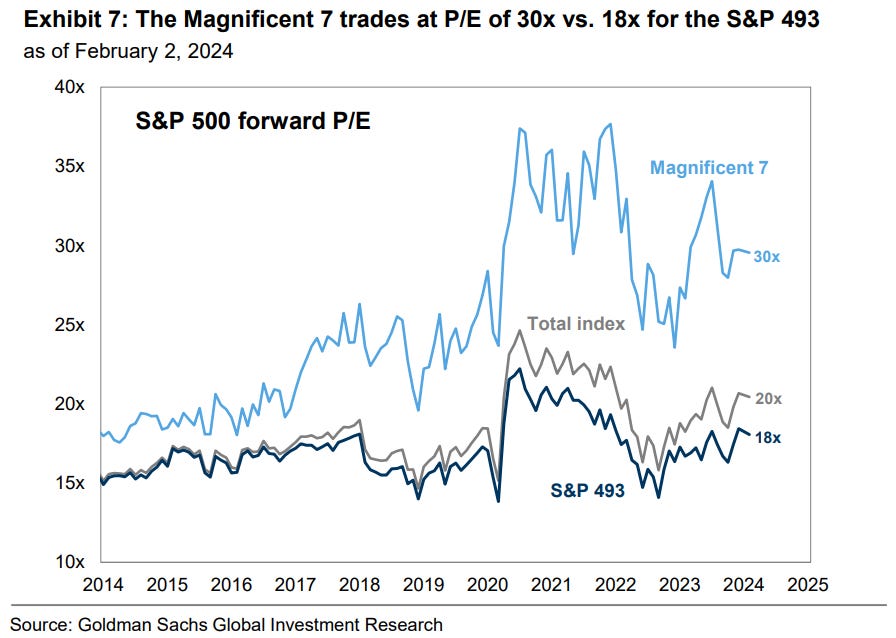
Elevated valuations is the most common pushback on the group. In aggregate, the Magnificent 7 stocks currently trade at a forward P/E multiple of 30x compared with 20x for the overall index and 18x for the remaining 493 S&P 500 companies.
So while some harp on expensive valuation, others focus on fundamental drivers of long-term performance.
Consider top-line and bottom-line growth, for instance.
Assuming NVDA meets consensus estimates, the Mag 7 generated $523 billion in sales (!!) during Q4, representing a YoY increase of 14%. Revenue growth for the remaining 493 stocks was a comparatively paltry 2%. Meanwhile, margins for the group expanded by nearly 7.5% (up to 23%) versus a 1.1% contraction (down to 9%) for the remaining 493 stocks in the S&P 500.
In fact, with all this growth, the Mag 7 now comprises 29% of the S&P 500 equity market cap and 22% of consensus 2024 net income.
Looking forward, the street is expecting revenue growth to be a key driver of returns for the Mag 7 group.
Bottom-up consensus expects the 7 companies will collectively grow sales at a 12% CAGR through 2026 compared with an 3% CAGR for the remaining 493 companies in the S&P 500 index. So while the market is be paying up more and more for each incremental share, top-line growth (above and beyond its peer groups) is a powerful medicine that cures most investor’s heartburn in doing so.
Source: Goldman Sachs Global Investment Research
Cash rules everything around me (C.R.E.A.M.)
As the market argues about the future path of interest rates, investors across different verticals are hoarding piles of cash just waiting to be deployed.
An update on sideline cash:
Private Equity: “record dry powder,” approaches $2.59 trillion
Mutual Funds: “cash is 1 standard deviation above average”
U.S. Households: “18 trillion in cash”
Source: S&P Global Market Intelligence, Financial Times, Wall Street Journal
European Q4 earnings tracker
The earnings season in Europe is looking underwhelming, as earnings growth is outright negative at -4% YoY with 20% of the EuroStoxx600 having reported.
The proportion of companies beating ESP estimates (45%) is the lowest since J.P. Morgan started tracking the data 15 years ago, and the proportion of companies beating sales estimates (30%) has fallen this quarter to record low levels.
Source: J.P. Morgan Markets
One simple tweet
This one, by way of SentimenTrader, caught fire on Twitter today:
Source: Jason Goepfert
That’s all for today.
Blake
Welcome to The Sandbox Daily, a daily curation of relevant research at the intersection of markets, economics, and lifestyle. We are committed to delivering high-quality and timely content to help investors make sense of capital markets.
Blake Millard is the Director of Investments at Sandbox Financial Partners, a Registered Investment Advisor. All opinions expressed here are solely his opinion and do not express or reflect the opinion of Sandbox Financial Partners. This Substack channel is for informational purposes only and should not be construed as investment advice. The information and opinions provided within should not be taken as specific advice on the merits of any investment decision by the reader. Investors should conduct their own due diligence regarding the prospects of any security discussed herein based on such investors’ own review of publicly available information. Clients of Sandbox Financial Partners may maintain positions in the markets, indexes, corporations, and/or securities discussed within The Sandbox Daily. Any projections, market outlooks, or estimates stated here are forward looking statements and are inherently unreliable; they are based upon certain assumptions and should not be construed to be indicative of the actual events that will occur.


Nice piece but I have to chuckle a bit when the argument for strong household balance sheets is " they could have so much more debt" or "they were a lot more on debt earlier". I think a big thing that's overlooked here is demographics. The country is older and it's not surprising that the 55+ group carries less debt. They also spend less.
And just who are the customers of the Mag 7? A bunch of serfs who will accept meager profits forever to tithe to the Lords of silicon?
And for cash...just where can it go? Someone has to hold it, no?