

U.S. positioned as world's largest oil and gas producer, plus Goldman Sachs upgrades its outlooks, the Misery Index, and global debt rises
The Sandbox Daily (10.10.2024)

Welcome, Sandbox friends.
It’s great to be back after an unexpected publishing hiatus over the last two days. Protip: if you find yourself in South Carolina Lowcountry, do not expect any internet. Any. However, the golf is exceptional; Chechessee Creek Club is a must visit for golfers.

Today’s Daily discusses:
U.S. is world’s largest producer of oil and gas
Goldman Sachs: upgrades market forecast, downgrades recession prospects
the not-so-miserable economy
global debt higher for 1st time since pandemic
Let’s dig in.
Markets in review
EQUITIES: Nasdaq 100 -0.13% | Dow -0.14% | S&P 500 -0.21% | Russell 2000 -0.55%
FIXED INCOME: Barclays Agg Bond -0.06% | High Yield -0.05% | 2yr UST 3.966% | 10yr UST 4.069%
COMMODITIES: Brent Crude +3.70% to $79.42/barrel. Gold +0.81% to $2,647.3/oz.
BITCOIN: -2.41% to $59,591
US DOLLAR INDEX: -0.07% to 102.861
CBOE EQUITY PUT/CALL RATIO: 0.59
VIX: +0.34% to 20.93
Quote of the day
“The pessimist complains about the wind; the optimist expects it to change; the realist adjusts the sails.”
- William Arthur Ward
The U.S. is the world’s largest producer of oil and gas
The price of Brent crude, the global oil benchmark, recently jumped to $79 per barrel due to the conflict between Israel and Hezbollah/Iran. While this represents a 13% increase from the recent low of $69 a month ago, oil prices are still roughly flat on the year and far below the 2022 peak of nearly $128.
Oil prices can be volatile and difficult to predict, but fears that the conflict in the Middle East would send prices skyrocketing above $100 a barrel have so far not materialized.

Historically, oil prices are influenced by both geopolitics and economic growth. While conflicts can cause prices to spike, as they did when Russia invaded Ukraine, sustained increases in oil prices have more often been the result of rising demand due to strong economic growth. The historic level of oil prices during the mid-2000s, for instance, was the result of rapid global growth prior to the 2008 housing crash and global financial crisis. Thus, geopolitics and growth tend to impact supply and demand, respectively, which can affect how long prices stay high and the resulting effects.
One reason the distinction between supply- and demand-driven shocks matters is because oil producers can respond to changing prices. Unlike in the mid-2000s, the U.S. is now the world's largest producer of crude oil. Advancements in exploration and drilling have increased output, allowing the industry to maintain high productivity levels.
According to the Energy Information Administration (EIA), these improvements have been key to sustaining U.S. oil production growth which now exceeds 13.2 million barrels per day.

In theory, this means that the U.S. can play the role of “swing producer” to increase supply when oil prices are high. Of course, this is an oversimplification since the U.S. still relies on foreign imports due to the different types of crude oil needed by refineries as well as the effects of various energy policies. Nonetheless, it helps to insulate the U.S. from geopolitics and possibly reduces the impact of oil shocks.
In the long run, world oil production is expected to outstrip demand over the next several years, according to the International Energy Agency (IEA). This is partly due to U.S. production, but it also reflects the changing dynamics of OPEC+. The group has extended production cuts into 2025 in order to maintain higher oil prices, although the incentives to renege on these commitments to gain market share are high among member countries. This has made the cartel less relevant over the past decade.
Despite these trends and the growing adoption of renewable energy sources, the world remains heavily reliant on oil, which means that it still serves as a transmission mechanism for geopolitical tension to influence the global economy.
A further spike in oil prices could act as a headwind to the economy and the “soft landing” the Fed is hoping to achieve. At the same time, there are many factors that make this less likely than in the past.
Source: Clearnomics
Goldman Sachs: upgrades market forecast, downgrades recession prospects
A recovery in the semiconductor cycle plus faster growth in mega-cap tech earnings has pushed Goldman Sachs to raise their 2025/2026 S&P 500 earnings and price targets – recognizing economic growth is stronger than broader estimates:
Ahead of 3Q 2024 earnings season, we raise our 2025 S&P 500 EPS forecast from $256 (+6%) to $268 (+11% year/year) and introduce a 2026 EPS estimate of $288 (+7%). We maintain our long-held full-year 2024 EPS forecast of $241 (+8%).
Today’s P/E multiple of 22x is in line with our macro model of fair value. We forecast the P/E will be unchanged at year-end 2024, and lift our index target to 6000 (from 5600) and our 12-month target to 6300 (from 6000), implying 4% and 10% upside, respectively.

At the same time, Goldman also dialed back their 12-month U.S. recession outlook to the unconditional long-term average of 15% citing recent strength in jobs data:
The most important reason is that the unemployment rate fell to 4.051% in September, marginally below both the June level and the threshold that activates the “Sahm rule.”
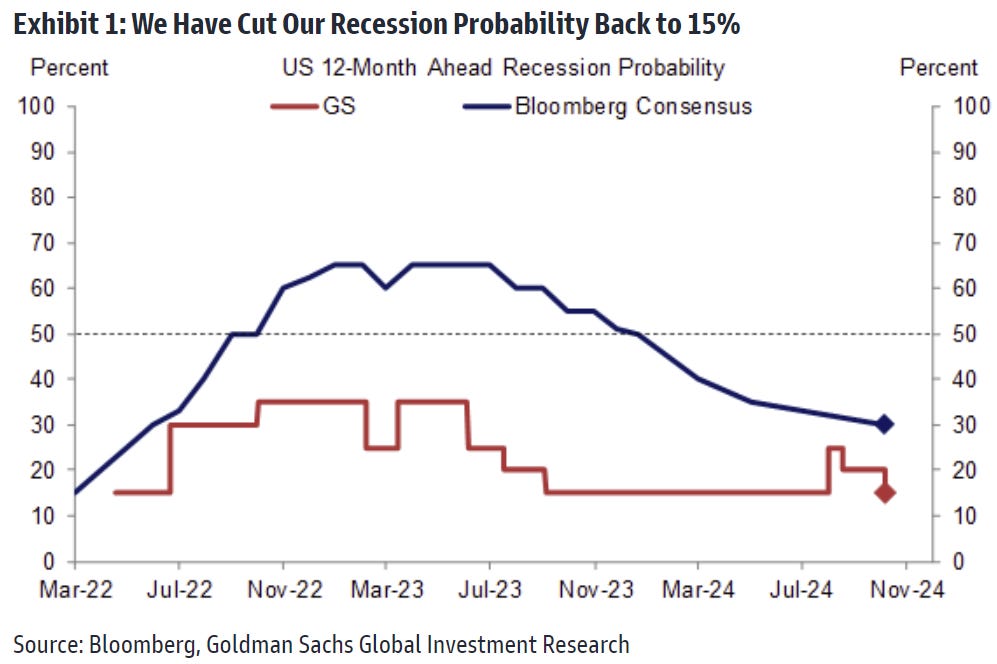
Source: Goldman Sachs Global Investment Research
The not-so-miserable economy
The so-called “Misery Index” – which combines the inflation and unemployment rates to gauge the measure of economic distress felt by everyday people – is currently at the low end of its post-covid trend.
At 6.5, the Misery Index is lower than it’s been 89% of the time in the last 50 years.

Source: Yardeni Research
Global debt higher for 1st time since pandemic
After three years of post-pandemic deleveraging, global debt as a share of GDP rose at the beginning of the year to 235%.
This was the highest excluding the pandemic, when debt to GDP ratios rose because GDP collapsed while government stimulus packages were put to work.

While many often see the run-up in debt as a government issue, private nonfinancial debt also contributed to the pick-up.
Emerging markets have led the charge in private debt as a percentage of GDP, much of it due to China, with its private debt as a proportion of GDP more than double that of other major emerging markets and even higher than many developed economies.

Source: Ned Davis Research
That’s all for today.
Blake
Questions about your financial goals or future?
Connect with a Sandbox financial advisor – our team is here to support you every step of the way!
Welcome to The Sandbox Daily, a daily curation of relevant research at the intersection of markets, economics, and lifestyle. We are committed to delivering high-quality and timely content to help investors make sense of capital markets.
Blake Millard is the Director of Investments at Sandbox Financial Partners, a Registered Investment Advisor. All opinions expressed here are solely his opinion and do not express or reflect the opinion of Sandbox Financial Partners. This Substack channel is for informational purposes only and should not be construed as investment advice. The information and opinions provided within should not be taken as specific advice on the merits of any investment decision by the reader. Investors should conduct their own due diligence regarding the prospects of any security discussed herein based on such investors’ own review of publicly available information. Clients of Sandbox Financial Partners may maintain positions in the markets, indexes, corporations, and/or securities discussed within The Sandbox Daily. Any projections, market outlooks, or estimates stated here are forward looking statements and are inherently unreliable; they are based upon certain assumptions and should not be construed to be indicative of the actual events that will occur.
Please see additional disclosures at the Sandbox Financial Partners website: