

What seasonal patterns like “Sell in May” mean for investors
The Sandbox Daily (5.6.2026)

Welcome, Sandbox friends.
Today’s Daily discusses:
seasonal patterns
Let’s dig in.
Blake
Markets in review
EQUITIES: Nasdaq 100 +2.08% | Russell 2000 +1.47% | S&P 500 +1.46% | Dow +1.24%
FIXED INCOME: Barclays Agg Bond +0.43% | High Yield +0.30% | 2yr UST 3.865% | 10yr UST 4.348%
COMMODITIES: Brent Crude -7.72% to $101.39/barrel. Gold +3.06% to $4,708.5/oz.
BITCOIN: -0.19% to $81,657
US DOLLAR INDEX: -0.43% to 98.03
CBOE TOTAL PUT/CALL RATIO: 0.84
VIX: +0.06% to 17.39
Quote of the day
“Small disciplines repeated with consistency every day lead to great achievements gained slowly over time.”
- John C. Maxwell, Author
What seasonal patterns like “Sell in May” mean for investors
The human brain is excellent at finding patterns, a skill that has helped us evolve as a species over time across impossible odds.
However, it can also lead us astray when there’s no real pattern at all, such as when we see shapes in clouds and the sand.

When it comes to investing, this is relevant because some patterns are important, such as the long-term relationship between the market and the economy, while many others are more of the variety of statistical anomalies.
Distinguishing between what makes for interesting trivia versus true investing principles is a challenging but important part of achieving long-term financial success.
Over the years, investors have identified many calendar and event-based patterns, including “sell in May and go away,” the January Effect, the Santa Claus rally, the Super Bowl indicator, and many many more.
Just ask Jeffrey Hirsch of the Stock Trader’s Almanac who pioneered this stuff alongside his dad.
After all, even when flipping a coin, you would expect streaks of several heads or tails in a row due to pure chance.
To better understand these effects, the key is to separate random noise from facts of how financial markets truly function.
While there are many observable market patterns, it’s helpful to review seasonal trends as a whole.
The chart below breaks out the S&P 500 into two distinct periods – pre-Millennium (1928 to 1999) and post-Millennium (2000 to present day).
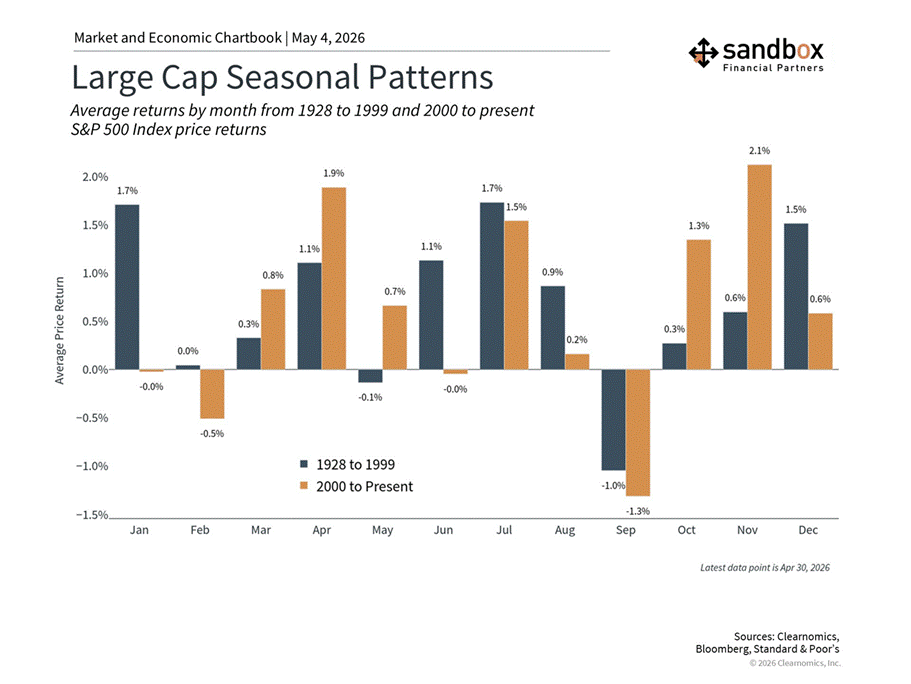
In the 20th century, some months were negative on average, while some were strongly positive.
For instance, May and September experienced declines of -0.1% and -1.0% on average, while December and January experienced significant positive returns.
It’s easy to see that the market hasn’t behaved the same each month, so it’s tempting to wonder if we should just simply invest during positive periods.
Yet, since 2000, several of these months have reversed earlier patterns. This may be because investors behaved differently after identifying this trend, something structurally changed in the market, or because it never truly existed at all.
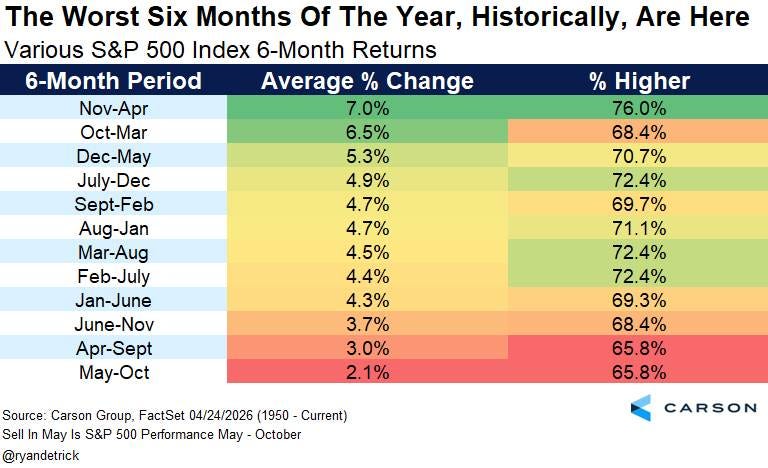
Historically, these observations have fueled concepts such as “Sell in May,” the idea that the 6-month period leading up to May experiences better returns than the other half of the year.
To wit, the 6-month period returns and hit rates are notoriously poor from May to October. Here’s the data from Ryan Detrick:
What should investors make of all this?
It’s commonly said that the simplest explanation may be the best, aka Occam’s Razor. Conceptually, this is often described as being “fooled by randomness,” distinguishing the signal from the noise.
Because stock market returns are difficult to predict, any historical stretch will naturally contain periods that look better or worse than others.
This doesn’t necessarily mean there’s an underlying reason for those differences, or that they will continue. After all, just as we can see objects in the clouds or the sand, we can find interesting patterns even in a completely random dataset.
In statistics and economics, researchers use the concept of “statistical significance” to try to distinguish between patterns that could be real and those that are coincidental.
It’s also important to distinguish causation from correlation, i.e., whether there is something unique to a particular calendar month driving these patterns, or if events simply happened to take place during those months.
For investors, these concepts matter because a pattern that emerged by chance, or that was tied to a specific historical era, can be interesting but offers little guidance for the future.
The temptation to time the market, whether by trading daily price movements or by following seasonal rules of thumb, is natural and understandable.
After all, if there were a few simple patterns that worked, it would be much easier than staying disciplined, saving steadily, and sticking to your investment strategy and financial plan.
However, the fact that doing these things is hard is exactly why they are rewarded in the long run.
For most longer-term oriented investors, the growth of their financial assets is tied less to calendar and event-based patterns and more towards cyclical and structural growth patterns in economic and earnings cycles.
Sources: Clearnomics, Ryan Detrick (Carson Group), Exhibit A
That’s all for today.
Blake
Questions about your financial goals or future?
Connect with a Sandbox financial advisor – our team is here to support you every step of the way!
Welcome to The Sandbox Daily, a daily curation of relevant research at the intersection of markets, economics, and lifestyle. We are committed to delivering high-quality and timely content to help investors make sense of capital markets.
Blake Millard is the Director of Investments at Sandbox Financial Partners, a Registered Investment Advisor. All opinions expressed here are solely his opinion and do not express or reflect the opinion of Sandbox Financial Partners. This Substack channel is for informational purposes only and should not be construed as investment advice. The information and opinions provided within should not be taken as specific advice on the merits of any investment decision by the reader. Investors should conduct their own due diligence regarding the prospects of any security discussed herein based on such investors’ own review of publicly available information. Clients of Sandbox Financial Partners may maintain positions in the markets, indexes, corporations, and/or securities discussed within The Sandbox Daily. Any projections, market outlooks, or estimates stated here are forward looking statements and are inherently unreliable; they are based upon certain assumptions and should not be construed to be indicative of the actual events that will occur.
Please see additional disclosures (click here)
Please see our SEC Registered firm brochure (click here)
Please see our SEC Registered Form CRS (click here)