

What three intermarket relationships say about the market cycle and risk appetite
The Sandbox Daily (10.16.2024)

Welcome, Sandbox friends.
Today’s Daily discusses:
one intermarket risk gauge stuck in the box
bonds aren’t stressed, are you?
High Beta stocks look to confirm broader trends
Let’s dig in.
Markets in review
EQUITIES: Russell 2000 +1.64% | Dow +0.79% | S&P 500 +0.47% | Nasdaq 100 +0.07%
FIXED INCOME: Barclays Agg Bond +0.13% | High Yield +0.18% | 2yr UST 3.935% | 10yr UST 4.014%
COMMODITIES: Brent Crude +0.20% to $74.40/barrel. Gold +0.45% to $2,691.0/oz.
BITCOIN: +1.70% to $67,881
US DOLLAR INDEX: +0.28% to 103.554
CBOE EQUITY PUT/CALL RATIO: 0.57
VIX: -5.14% to 19.58
Quote of the day
“Change happens when the pain of staying the same is greater than the pain of change.”
- Tony Robbins
One intermarket risk gauge stuck in the box
One of our favorite intermarket indicators to gauge risk appetite is the ratio of Consumer Discretionary (XLY) stocks to their Consumer Staples (XLP) counterparts.
Throughout history, this ratio has put in divergences at significant turning points, acting as an excellent leading indicator for the overall market.
For example, in the chart below, you can see the ratio peaked in late November 2021 which was a clean signal that market dynamics were shifting prior to the 2022 bear market. The ratio then bottomed in December 2022, roughly two months after the official index cycle low was put in, thus confirming a new trend (higher) had begun.
Over the last year or so, this classic risk indicator has been rangebound.
More recently, risk appetite has rebounded sharply since the short-term double bottom in August and September, however a push higher for XLY/XLP through overhead resistance would be an encouraging feather in the cap for the bulls.
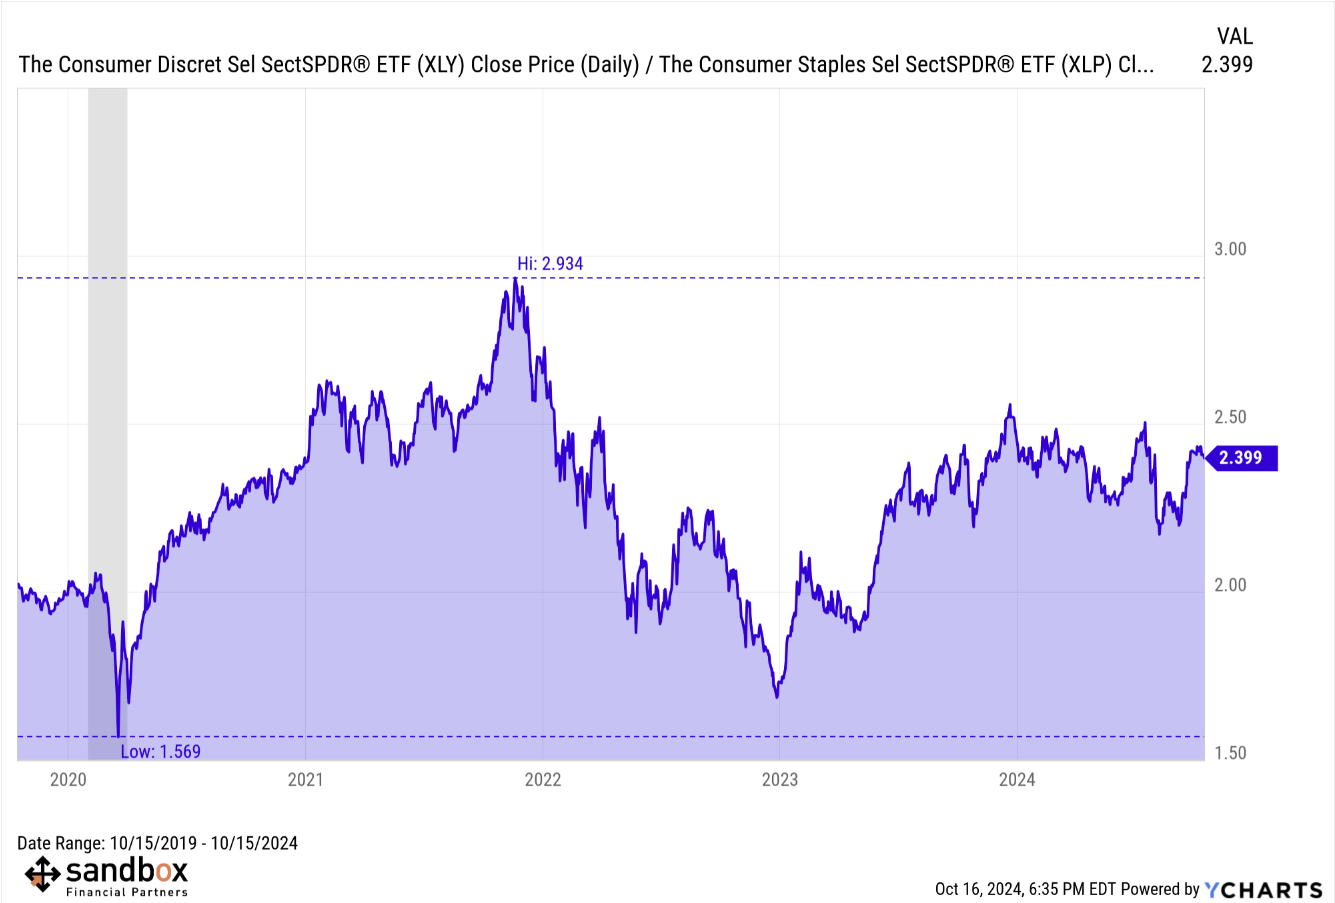
Discretionary stocks tend to be more cyclical and carry higher valuations than the relatively safer and more defensive Consumer Staples. Naturally, investors take on more risk during bull markets – bidding up the price of Discretionary stocks relative to Staples – and less risk during bear markets.
Seeing this ratio make a new high would have the characteristics of a bull market, as it speaks to investors positioning themselves offensively.
For this reason, we are watching for a clean breakout above ~2.50 which could prove to be another major advantage for the bulls.
Source: YCharts
Bonds aren’t stressed, are you?
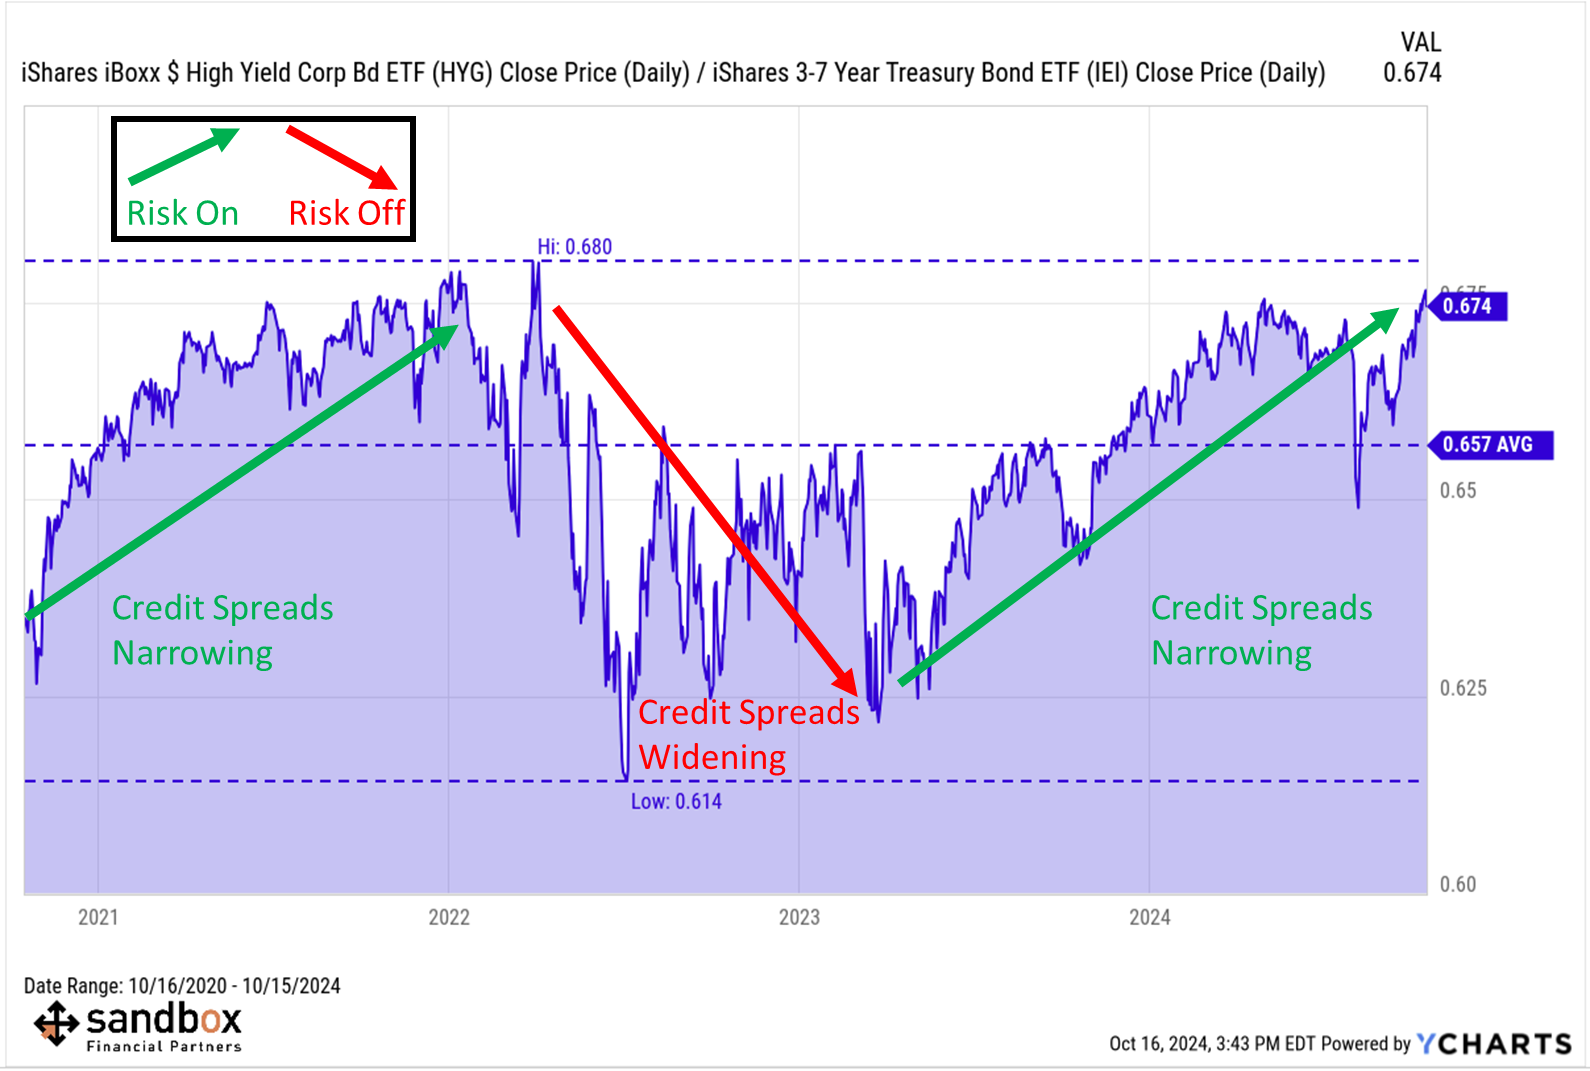
When markets are under pressure, it shows up in credit spreads.
The bond market is the biggest asset class in all of capital markets, with a total valuation of roughly $140 trillion. If there’s serious systemic risk in the stock market, credit spreads will notify investors.
So far, these spreads have been narrowing, not widening – despite the temporary twin growth scares from early August and early September.
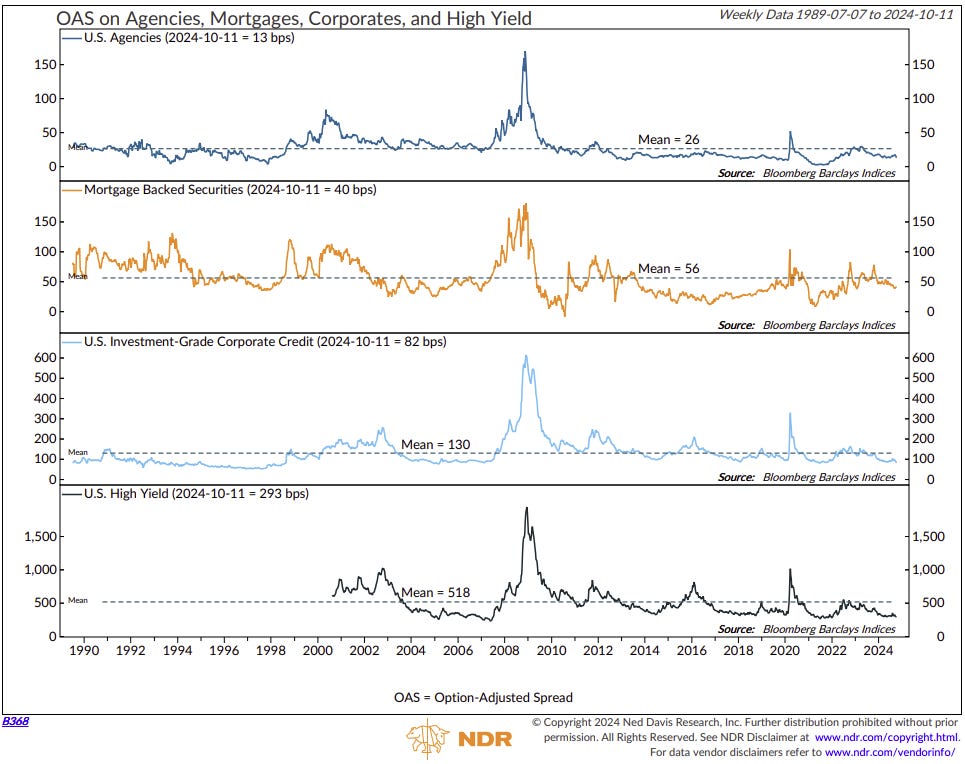
The U.S. Investment Grade option-adjusted spread (OAS) is currently around 82 bps, well below its mean of 130 bps since 1990. The all-time low was 52 bps in August 1997, while the pandemic low was 81 bps in July 2021.
Meanwhile, High Yield spreads are currently around 293 bps, well below its mean of 518 bps since August 2000. The record low was 234 bps in May 2007, while the pandemic low was 266 bps.
Equities benefit when credit spreads contract, and that’s exactly the environment we find ourselves in now.
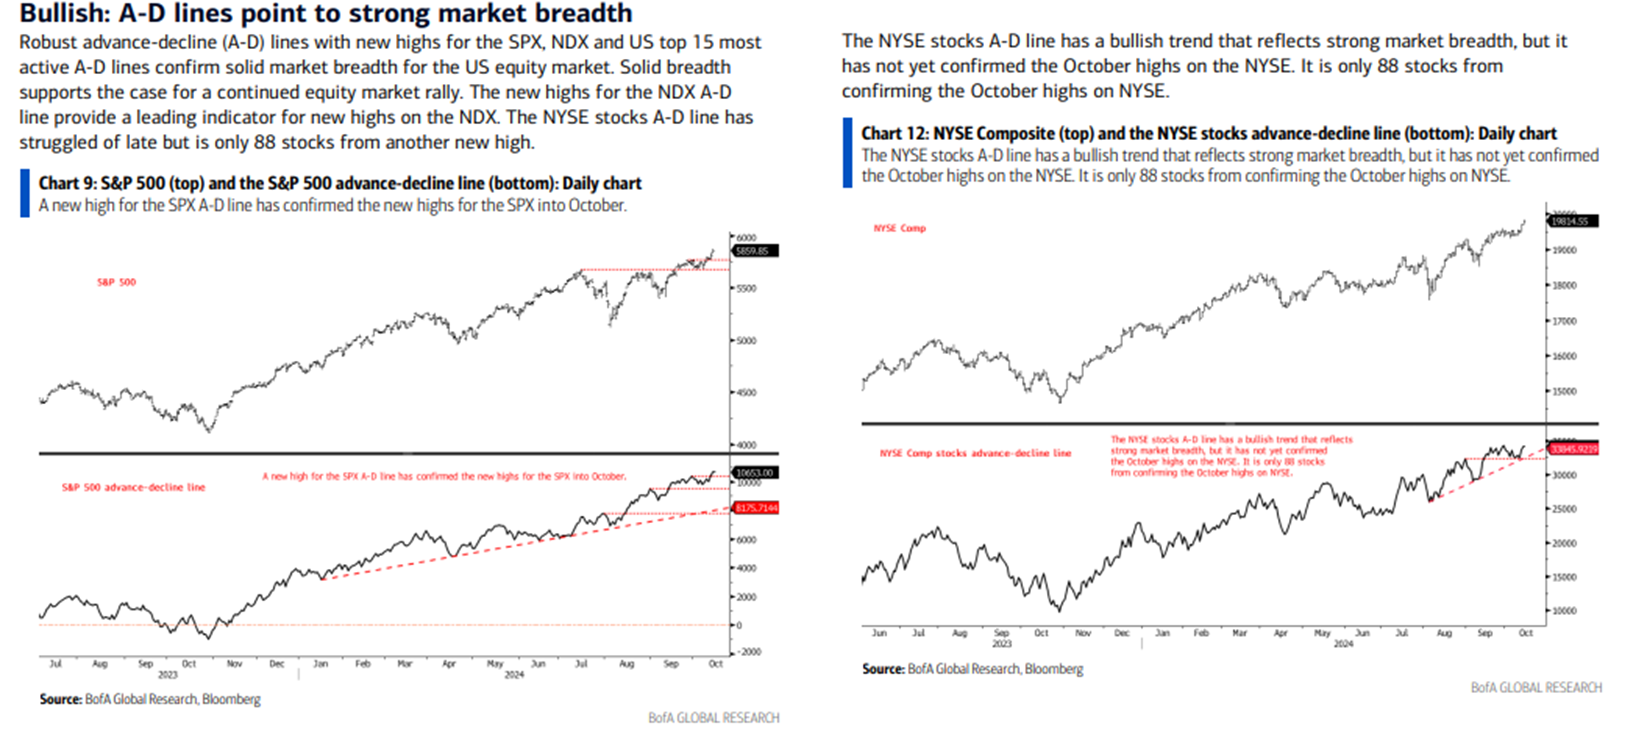
With more stocks pushing higher and participation expanding – the NYSE Advance-Decline Line is at all-time highs – stock market bears have little to support their thesis.
Corporate credit spreads are historically tight as default risk has diminished and the economy grows above-trend.
Source: YCharts, St. Louis Fed, Ned Davis Research, Bank of America
High Beta stocks look to confirm broader trends
Back to stocks and another popular risk measure that provides us insight into identifying the market cycle as well as general risk appetite: the relationship between High Beta stocks and Low Volatility stocks.
More often than not, this ratio moves in the same general direction and path as the broader market averages, like the S&P 500 index. It is when this indicator moves in opposite directions do we get some interesting information, a signal perhaps.
Since this ratio peaked in mid-July, we can see that High Beta stocks have rallied strongly off its near-term bottom in September but have since tapered off (the ratio is currently stalling out). Currently, it remains firmly off the 2024 high.
But, this is happening while the S&P 500 has made multiple new highs over the last month.
This relationship divergence typically doesn’t last long, and one of the two corrects itself (SPBH/SPLV or SPX) to follow the same direction.
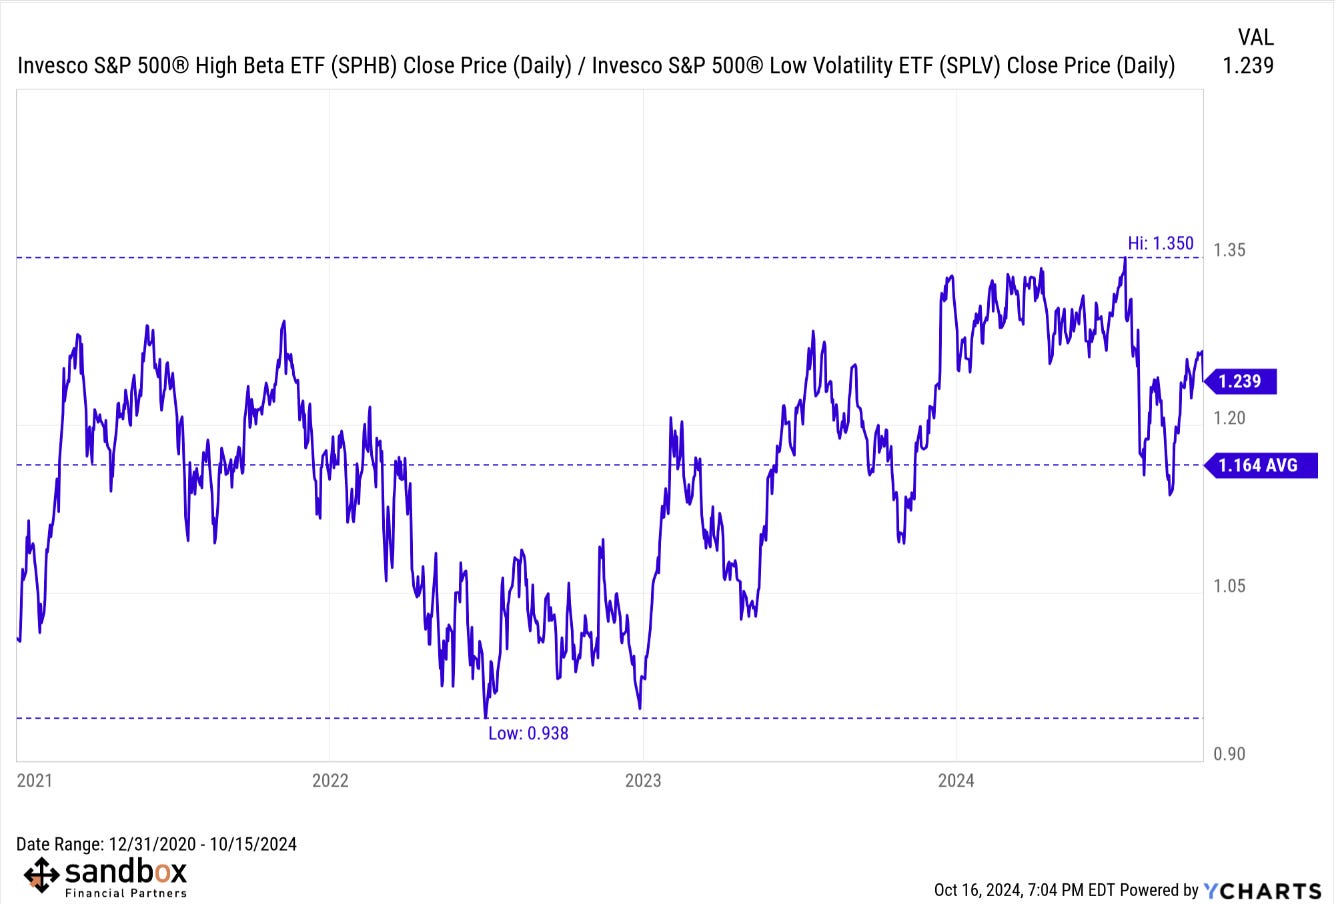
Until this risk indicator gains further upward momentum, it tells me that I should be cautious in my short-term outlook.
And yet, we should also be mindful that not all risk-on / risk-off metrics always line up cleanly. In fact, it is perfectly normal to see many signals confirm the broader trend while others are stuck in no man’s land working resolving themselves.
Source: YCharts
That’s all for today.
Blake
Questions about your financial goals or future?
Connect with a Sandbox financial advisor – our team is here to support you every step of the way!
Welcome to The Sandbox Daily, a daily curation of relevant research at the intersection of markets, economics, and lifestyle. We are committed to delivering high-quality and timely content to help investors make sense of capital markets.
Blake Millard is the Director of Investments at Sandbox Financial Partners, a Registered Investment Advisor. All opinions expressed here are solely his opinion and do not express or reflect the opinion of Sandbox Financial Partners. This Substack channel is for informational purposes only and should not be construed as investment advice. The information and opinions provided within should not be taken as specific advice on the merits of any investment decision by the reader. Investors should conduct their own due diligence regarding the prospects of any security discussed herein based on such investors’ own review of publicly available information. Clients of Sandbox Financial Partners may maintain positions in the markets, indexes, corporations, and/or securities discussed within The Sandbox Daily. Any projections, market outlooks, or estimates stated here are forward looking statements and are inherently unreliable; they are based upon certain assumptions and should not be construed to be indicative of the actual events that will occur.
Please see additional disclosures at the Sandbox Financial Partners website: