

What to make of the recent selling pressure in U.S. stocks and why we'll be just fine
The Sandbox Daily (8.1.2024)

Welcome, Sandbox friends.
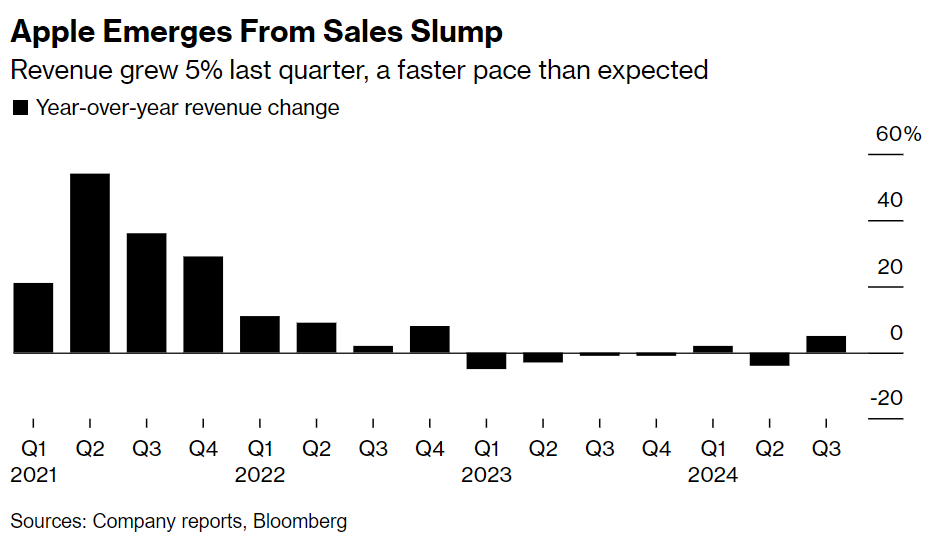
LOTS of blood in the streets today with ugly red candles everywhere (more on that below), the 10-yr U.S. Treasury breached the psychologically important level of 4.0% for the 1st time since early February, Wall Street Journal reporter Evan Gershkovich is released from Russian prison after spending 491 days jailed on farce espionage charges, and Apple emerges from its long dark winter (sales slump).
Today’s Daily discusses:
what to make of the recent selling pressure in U.S. equities
Let’s dig in.
Markets in review
EQUITIES: Dow -1.21% | S&P 500 -1.37% | Nasdaq 100 -2.44% | Russell 2000 -3.03%
FIXED INCOME: Barclays Agg Bond +0.42% | High Yield -0.22% | 2yr UST 4.154% | 10yr UST 3.981%
COMMODITIES: Brent Crude -0.98% to $80.05/barrel. Gold +0.72% to $2,490.9/oz.
BITCOIN: -0.58% to $64,722
US DOLLAR INDEX: +0.24% to 104.341
CBOE EQUITY PUT/CALL RATIO: 0.59
VIX: +13.63% to 18.59
Quote of the day
“Savor the joy of others. It is abundant and free and it will lift your spirits and boost your wellbeing even as you add positive energy to the world.”
- Phil Pearlman, Pearl Institute in the 2024 Stock Trader's Almanac
Chart pack to alleviate your concerns over the recent selling pressure
The defining characteristics of this current bull market run off the October 2022 lows, then again off the 4Q23 pullback, have been market concentration and narrow leadership. These periods have persisted in the past, but perhaps due to the accessibility and pervasiveness of news and media today, this discussion – and concern of many – seems to be everywhere, all the time in the present day.
It seems like everyone and their mother has been asking for the broadening of the market – away from the Magnificent 7 and mega-cap tech and into under-owned and under-loved corners of the market – and yet, as this summer rotation unfolds, people are running around like their hair is on fire now that the moment has arrived.
Will it persist? What does it mean long-term?
I’m not entirely sure yet. In fact, nobody is. But it’s here for now and these shifts must be respected.
So, while the tech-focused and market-cap weighted S&P 500 and Nasdaq 100 benchmarks seem to be stacking one loss on top of another, I want to use this space as an opportunity to show that the market internals are doing just fine. At least, for now.
78% of the index constituents within the S&P 500 are in uptrends, which is higher than a few weeks ago – despite the index itself being lower.
How is that possible? Because the largest companies have pulled back, their performance has a larger contribution to the index performance and will mask much of the other S&P 490 strength.

As Josh and Michael discussed on this week’s episode of What Are Your Thoughts, July was the strongest month on record since the 1990s in terms of specific stocks outperforming the index itself – at a shade over 70%.
Take a bow, Kevin Gordon and Charles Schwab, excellent chart.

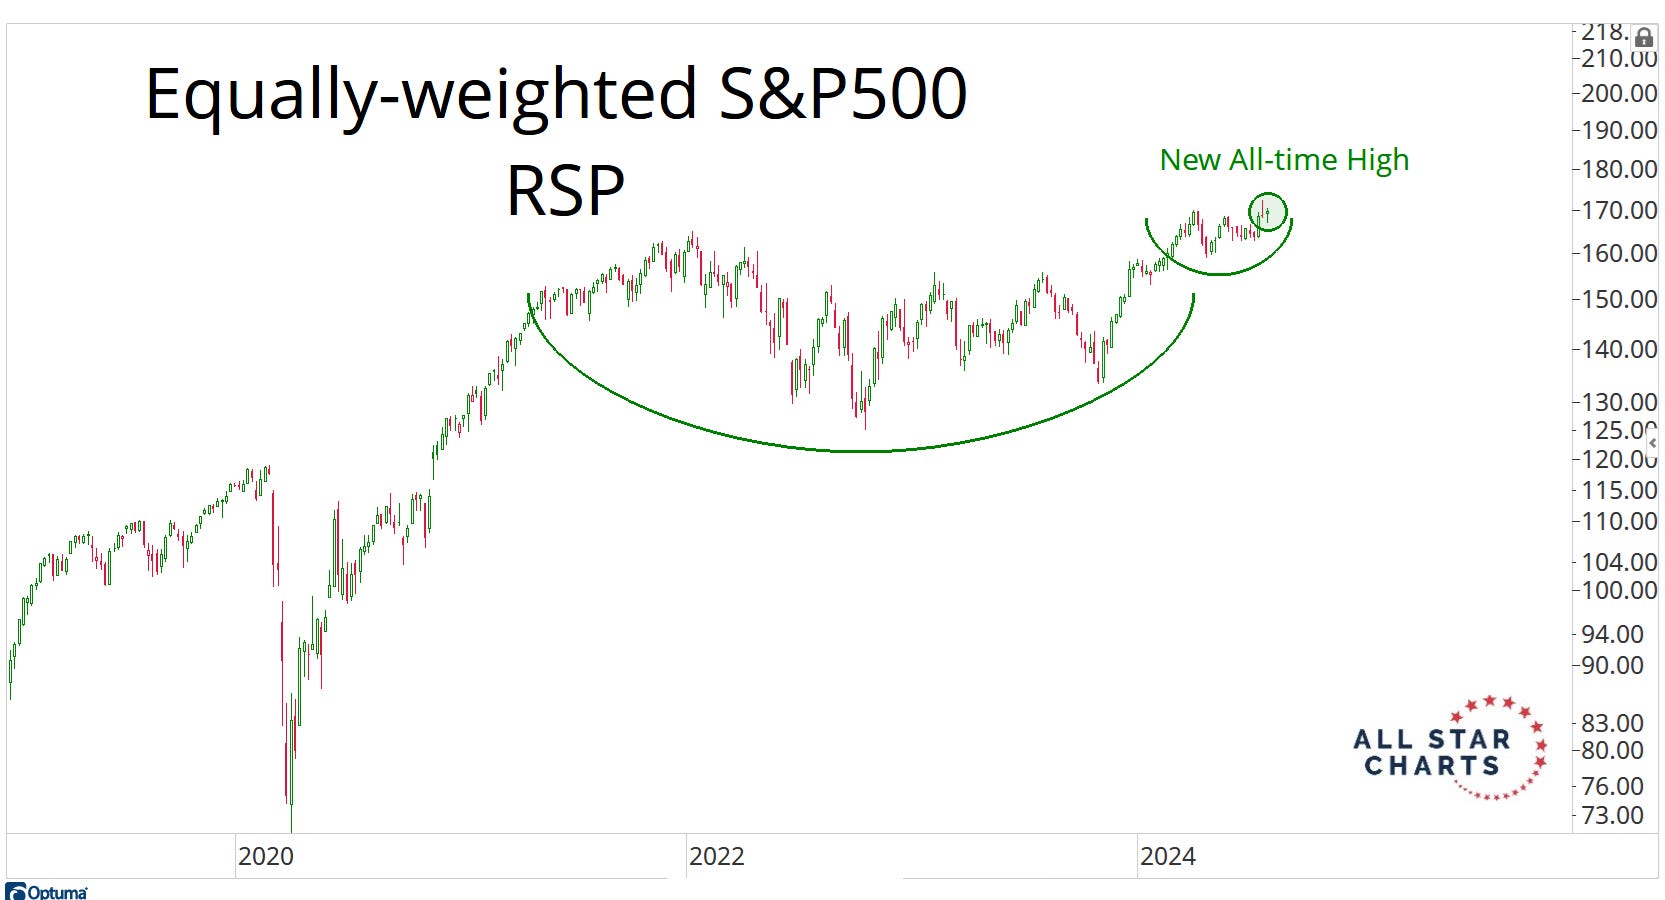
If one is to remove the market-cap weight factor and simply equal-weight all the 500 constituents in the index, you’ll notice that index ($RSP) printed a fresh all-time time last week on a closing basis.
Market breadth is strong across up and down the cap stack, too.
The S&P 500 (large-cap), the S&P 400 (mid-cap), and the S&P 600 (small-cap) all register far more 1-month, 3-mo, 6-mo, and 12-mo New Highs than corresponding New Lows.
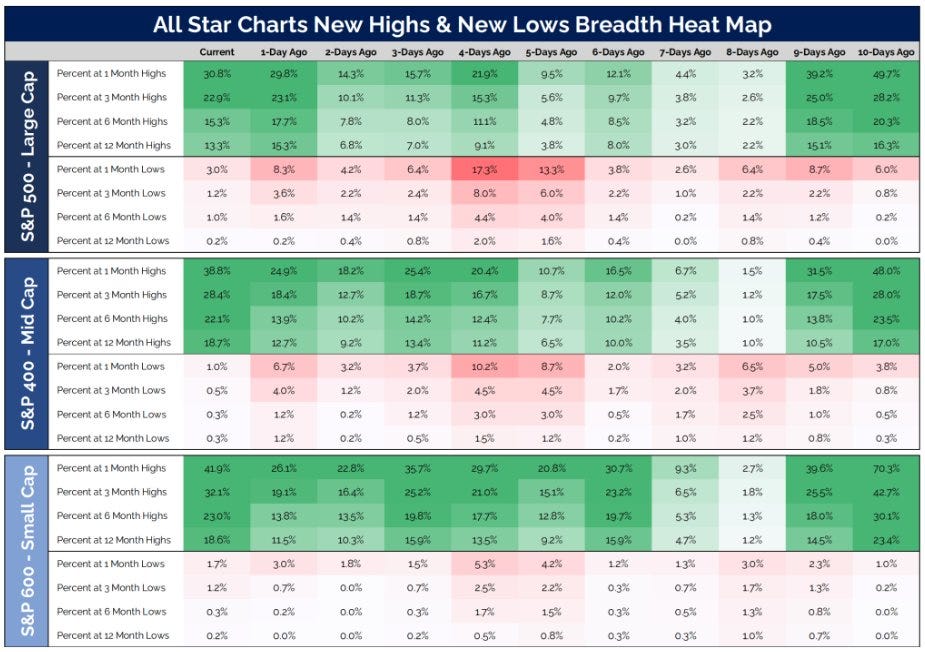
In fact, it’s mathematically impossible to have any correction or bear market when the list of stocks making New Lows is nothing but dust and tumbleweeds.

If you go sector-by-sector across the U.S. stock market, you’ll notice that all of them are in uptrends, as measured by the short-dated moving average (50-DMA) being higher than the long-dated moving average (200-DMA). The general direction of the underlying market is higher no matter which basket of stocks you choose.

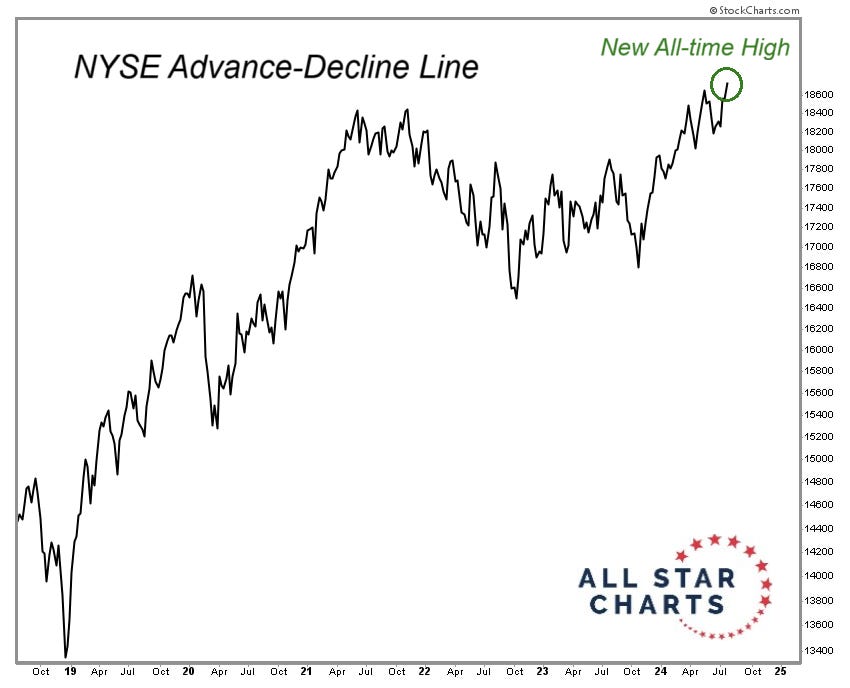
And, if we broaden the aperture a bit and include all the domestic common stock issues trading on the New York Stock Exchange, you’ll notice the number of issues advancing minus the number of issues declining made an all-time high on Friday of last week.
The NYSE Advance-Decline Line just produced its strongest print ever. If the NYSE A/D Line wasn’t making new highs, then that would be a signal of breadth divergence from price.
But… this A/D Line moving up and to the right is confirmation of the broader uptrend.
So, does this mean the stock market is perfect and it’s all rose-colored glasses and sunflowers?
No, of course not.
But, just because the Magnificent 7 is taking a breather does not mean the rest of the market is broken. After all, these are the biggest companies in the world and they command to the most eyeballs and contributions to performance.

Remember, it’s a market of stocks and the basket of them is moving higher.
Source: Jurrien Timmer, Daily Chartbook, Grant Hawkridge, All Star Charts, Andrew Thrasher
That’s all for today.
Blake
Welcome to The Sandbox Daily, a daily curation of relevant research at the intersection of markets, economics, and lifestyle. We are committed to delivering high-quality and timely content to help investors make sense of capital markets.
Blake Millard is the Director of Investments at Sandbox Financial Partners, a Registered Investment Advisor. All opinions expressed here are solely his opinion and do not express or reflect the opinion of Sandbox Financial Partners. This Substack channel is for informational purposes only and should not be construed as investment advice. The information and opinions provided within should not be taken as specific advice on the merits of any investment decision by the reader. Investors should conduct their own due diligence regarding the prospects of any security discussed herein based on such investors’ own review of publicly available information. Clients of Sandbox Financial Partners may maintain positions in the markets, indexes, corporations, and/or securities discussed within The Sandbox Daily. Any projections, market outlooks, or estimates stated here are forward looking statements and are inherently unreliable; they are based upon certain assumptions and should not be construed to be indicative of the actual events that will occur.
Really great write up and charts, as well as a breath of fresh air alongside the doom and gloomers that have been holding on to permabear arguments for the last 2 years while the Nasdaq has gone up 100%. Thanks for sharing!